
Setting the APx Generator Level for Arbitrary Waveforms
Within APx500 software, arbitrary waveforms can be generated in many measurements by loading a .wav file containing the waveform. However, specifying the generator level for such waveforms can be tricky, because in almost all instances, the Generator Level control in AP audio analyzers is calibrated for pure sine signals. In this post, we describe the relationship between the Generator Level setting and the measured level for arbitrary waveforms, as well as a procedure to help choose an appropriate Generator Level control setting.
Generating a .wav file
When the selected generator Waveform in an APx measurement is set to a loaded waveform file (typically a .wav file), the generated waveform is scaled such that a full-scale sine wave would result in an rms level equal to the Generator Level setting in rms units.
This is easy to demonstrate if the audio file contains a pure sine signal at a known level. For example, consider the Reference Level .wav files created by the APx Waveform Generator Utility. This utility can be used to create a variety of .wav files that are useful for audio test, including a set of files labeled “Reference Level” containing a 997 Hz sine wave at levels of 0, -1, -3, -20 and -60 dBFS. With the APx Generator Level set to 0 dBV (1.0 Vrms), if the 0 dBFS waveform is loaded and selected, the level generated will be exactly 0 dBV (1.0 Vrms). Similarly, if the -20 dBFS waveform is loaded and selected, a Generator Level setting of 0 dBV will result in a generated signal level of -20 dBV (0.10 Vrms). And so on for the other .wav files in this set.
The relationship between the Generator Level control and the generated level is less straightforward for arbitrary waveforms. For example, consider the speech waveform in Figure 1 – one of the POLQA speech waveform files installed with the APx software (POLQA-F1-S1-48k.wav). The top graph shows the .wav file contents scaled from -1.0 to +1.0 D, as measured using Input Connector = File (Digital Units). The middle graph represents the signal acquired in analog loopback by loading the .wav file into the generator and generating it with the Level set to 1.0 Vrms. The bottom graph is the RMS Level versus time of this signal, recorded in Bench Mode at a rate of 250 readings per second. As shown, the rms level varies from about -115 dBV (the noise floor) to -13 dBV, with the active speech parts of the waveform at a level of about -25 dBV. An estimate of the overall rms level of the acquired signal can easily be obtained using an RMS derived result, derived from the RMS Level versus time result (i.e., Add Derived Result – Min/Max Statistics – Single Value – RMS). For the waveform in Figure 1, the resulting overall rms value is -23.085 dBFS.
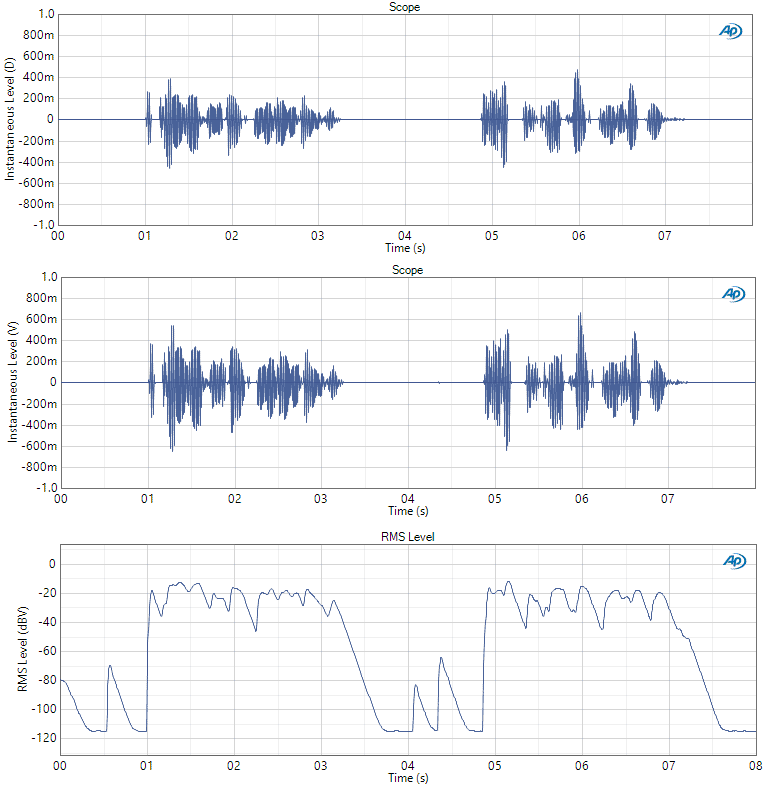
Figure 1. A speech waveform (top) loaded as a .wav file into the generator; the waveform acquired in analog loopback (middle) and its RMS Level versus time (bottom) recorded at 250 readings per second.
The one-to-one scaling relationship between the Generator Level setting and the generated level of a sine wave that peaks at digital full scale can be used to advantage when an arbitrary waveform file peaks at digital full scale. For example, consider Figure 2. The top graph shows the speech signal of Figure 1, scaled such that its maximum instantaneous value is at digital full scale (±1.0 D). The bottom graph is the signal acquired by generating this waveform in analog loopback with the Generator Level set to 1.0 VP. Note that the maximum instantaneous value of this acquired waveform is precisely 1.0 V.

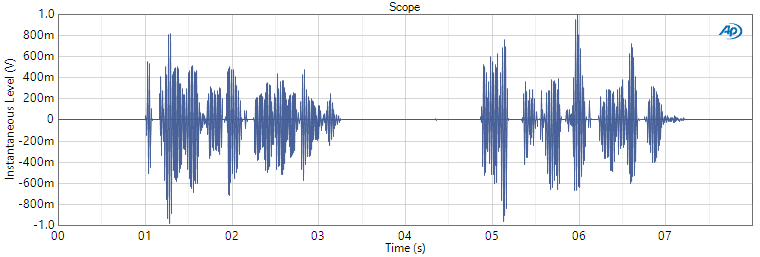
Figure 2. The speech waveform of Figure 1 scaled such that the maximum instantaneous level is 1.0 D (top) and the waveform acquired when this signal is generated in analog loopback at a Generator Level of 1.0 V<sub>P</sub>.
Choosing an Appropriate Generator Level for Arbitrary Waveforms
For arbitrary waveforms (including noise), a good way to determine the required Generator Level setting is as follows:
1. Set the input low pass and high pass filters for the desired measurement bandwidth.
2. Set the Generator Level to an initial value VG1.
3. Generate the signal and measure the resulting Level VM1.
4. Calculate the Generator Level (VGT) required to achieve the target measured level (VMT) using equation (1), below, for levels expressed in linear units (Vrms or FS, etc.) or equation (2) for levels expressed in dB units (dBV or dBFS, etc.)
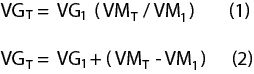
For example, suppose the target for the measured overall rms level is VMT = -20.0 dBV. For the waveform in Figure 1, a generator level of 1.0 Vrms (VG1 = 0.0 dBV) resulted in a measured overall rms level of VM1 = -23.08 dBV. From equation (2), we calculate VGT = +3.08 dBV. Applying this value to the Generator Level control results in a measured overall level of -20.00 dBV, which meets the target level exactly.
Note that for nonlinear systems, such as when setting the acoustic level radiated from a loudspeaker at a certain point, it may take more than one iteration to find the generator level needed to achieve the target level.
Using version 5.0.1 of APx500 software (released April 2, 2019), users can configure the analog generator to stay in a fixed output range. This is especially useful for testing acoustic devices, and some electronic devices.
Read more
Learn about applications, and you’ll get tips and tricks of test and measurement
Read more
Benchmarks. They are vital to ensure the R&D team produce a compelling new product or service and are essential on the production line of a manufacturing facility.
Read more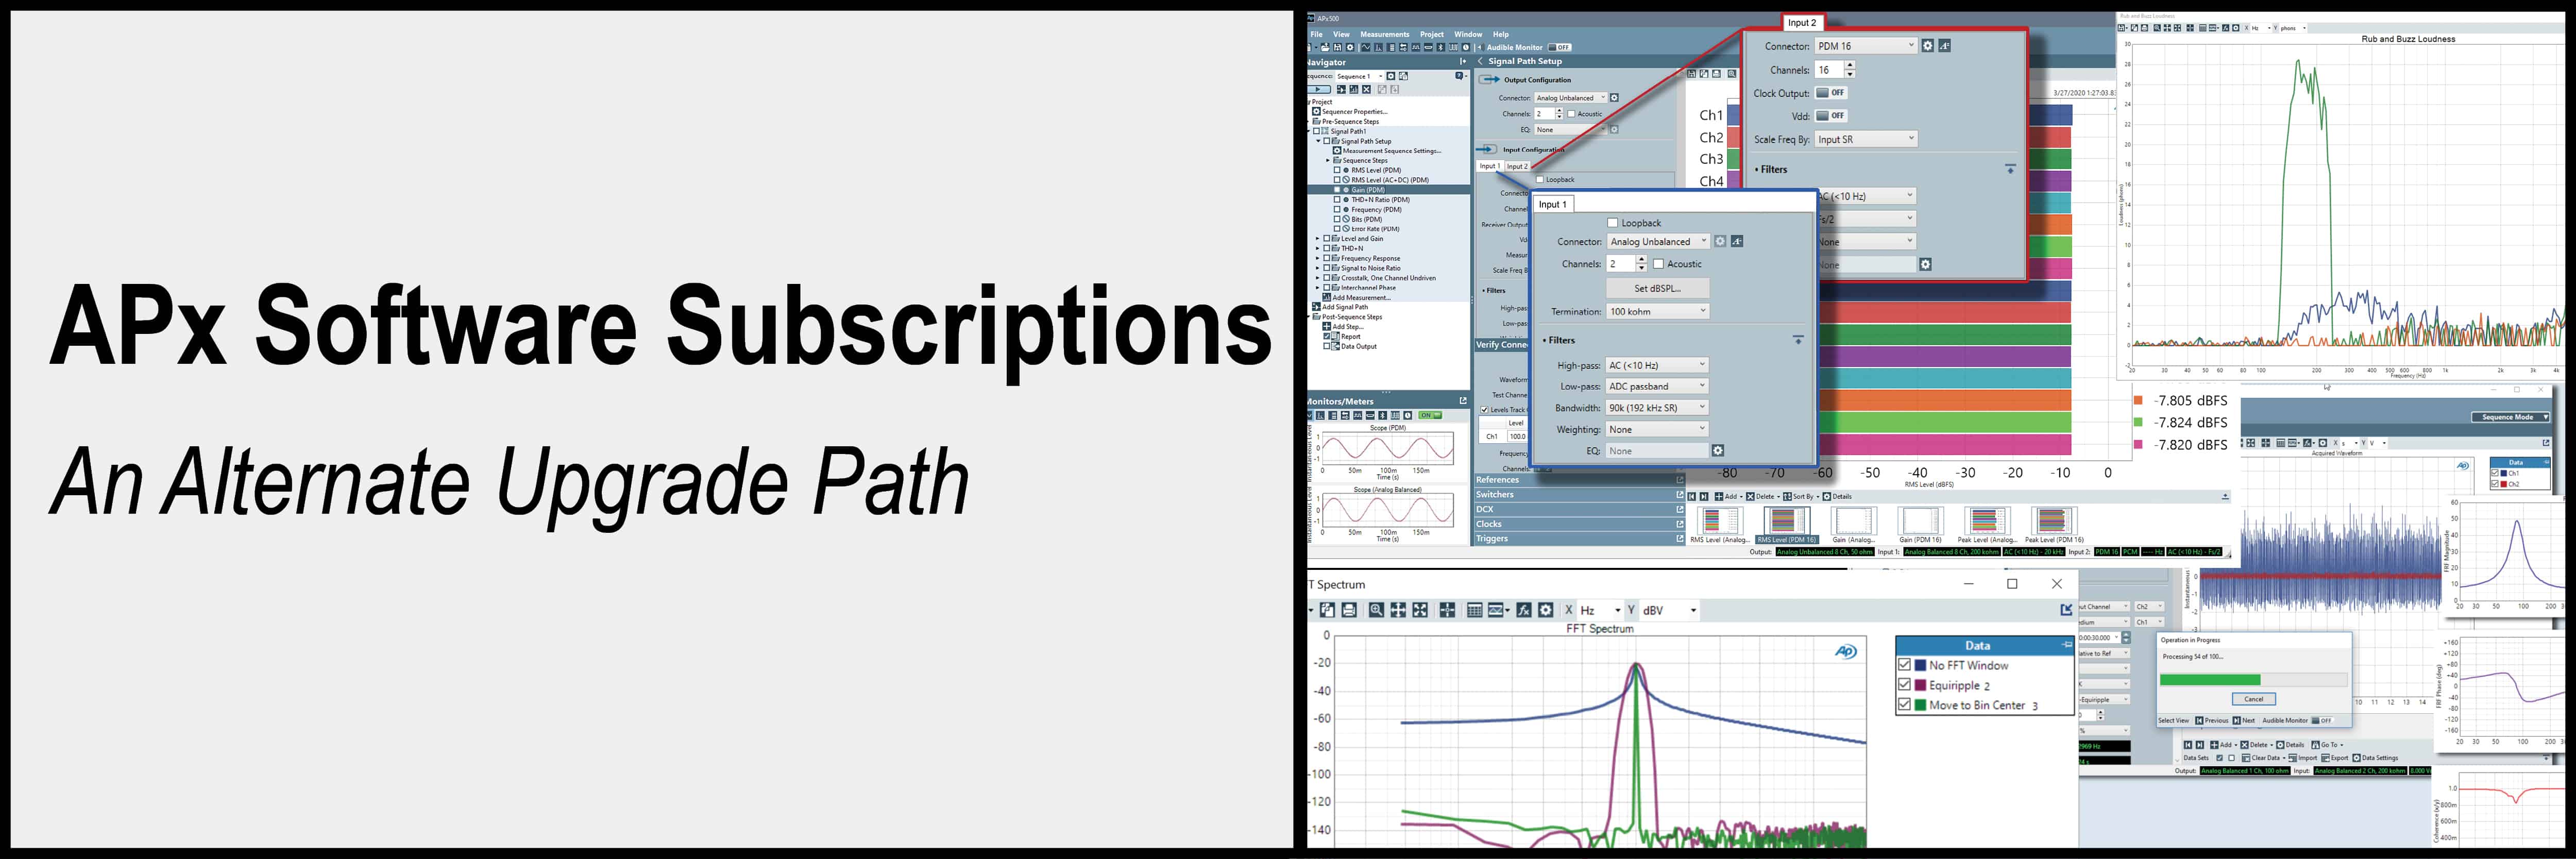
Introducing a new way to access all the latest APx500 software versions
Read more