

Why Are Chirps Always Swept from Low to High?
If you look at any APx measurement using a log-swept sine stimulus (a chirp), you might notice that the signal is always swept from low to high frequency, for example, from 20 Hz to 20 kHz. And while you can change the frequency range by raising the start frequency and lowering the stop frequency, you cannot configure the measurement to sweep from high to low frequency, as you can with the classic stepped sine sweep measurements.
This is a consequence of how the linear and non-linear responses of the DUT are separated, allowing the impulse response of the DUT to be determined and providing the ability to evaluate the harmonic distortion products.
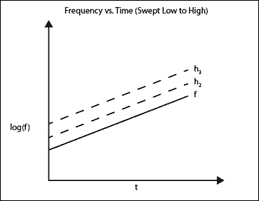
Figure 1: Chirp measurement result swept from low to high.
Figure 1 shows a chirp measurement result swept from low to high. The time-frequency domain example illustrates the linear response of the DUT to the chirp stimulus. The linear response of the DUT is represented by the solid straight line. The harmonic distortion responses are also shown, and appear as dotted lines parallel to the DUT’s response.
Using a mathematical process called deconvolution, the impulse response of the DUT can be derived from the DUT output signal. When the delay is removed, the linear response of the DUT appears as the large impulse at time zero in Figure 2. Distortion components appear as smaller impulses (h2, h3, …) located before the main impulse.
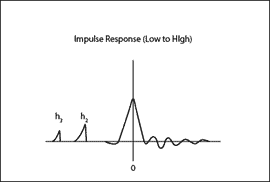
Figure 2: Impulse response swept low to high.
From this data, we can view the results in the frequency domain and use windowing to isolate the data of interest. This allows us to see just the frequency response of the DUT, view the harmonics, and derive other useful results.
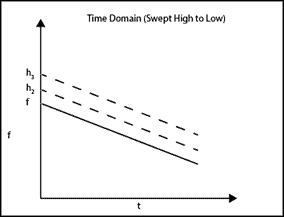
Figure 3: High to low chirp.
If you take the same DUT and apply a high to low chirp, as shown in Figure 3, you get a similar result. The harmonic distortion responses still appear as lines above the fundamental frequency in the time domain graph. However, when the response to the high to low chirp is deconvolved, the harmonics instead appear to the right of the DUT impulse response, as shown in Figure 4.
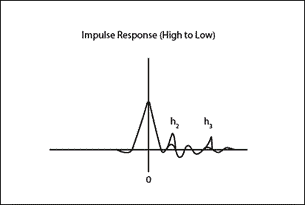
Figure 4: Harmonics to the right of the DUT impulse response.
As you can see from the illustration, when the harmonic responses are to the right of the linear response, they can mix with the DUT impulse response, effectively preventing the ability to window out and isolate desired components. This problem is worsened for acoustic measurements in ordinary rooms, where acoustic reflections appear as secondary impulses to the right of the main impulse. Because of this, accurate harmonic distortion results can’t be derived from the data.
To avoid this issue, only low to high sweeps are allowed for log-swept sine stimulus measurements.
1. T. Kite, “Measurement of audio equipment with log-swept sine chirps.” Presented at the 117th AES Convention San Francisco, 2004.
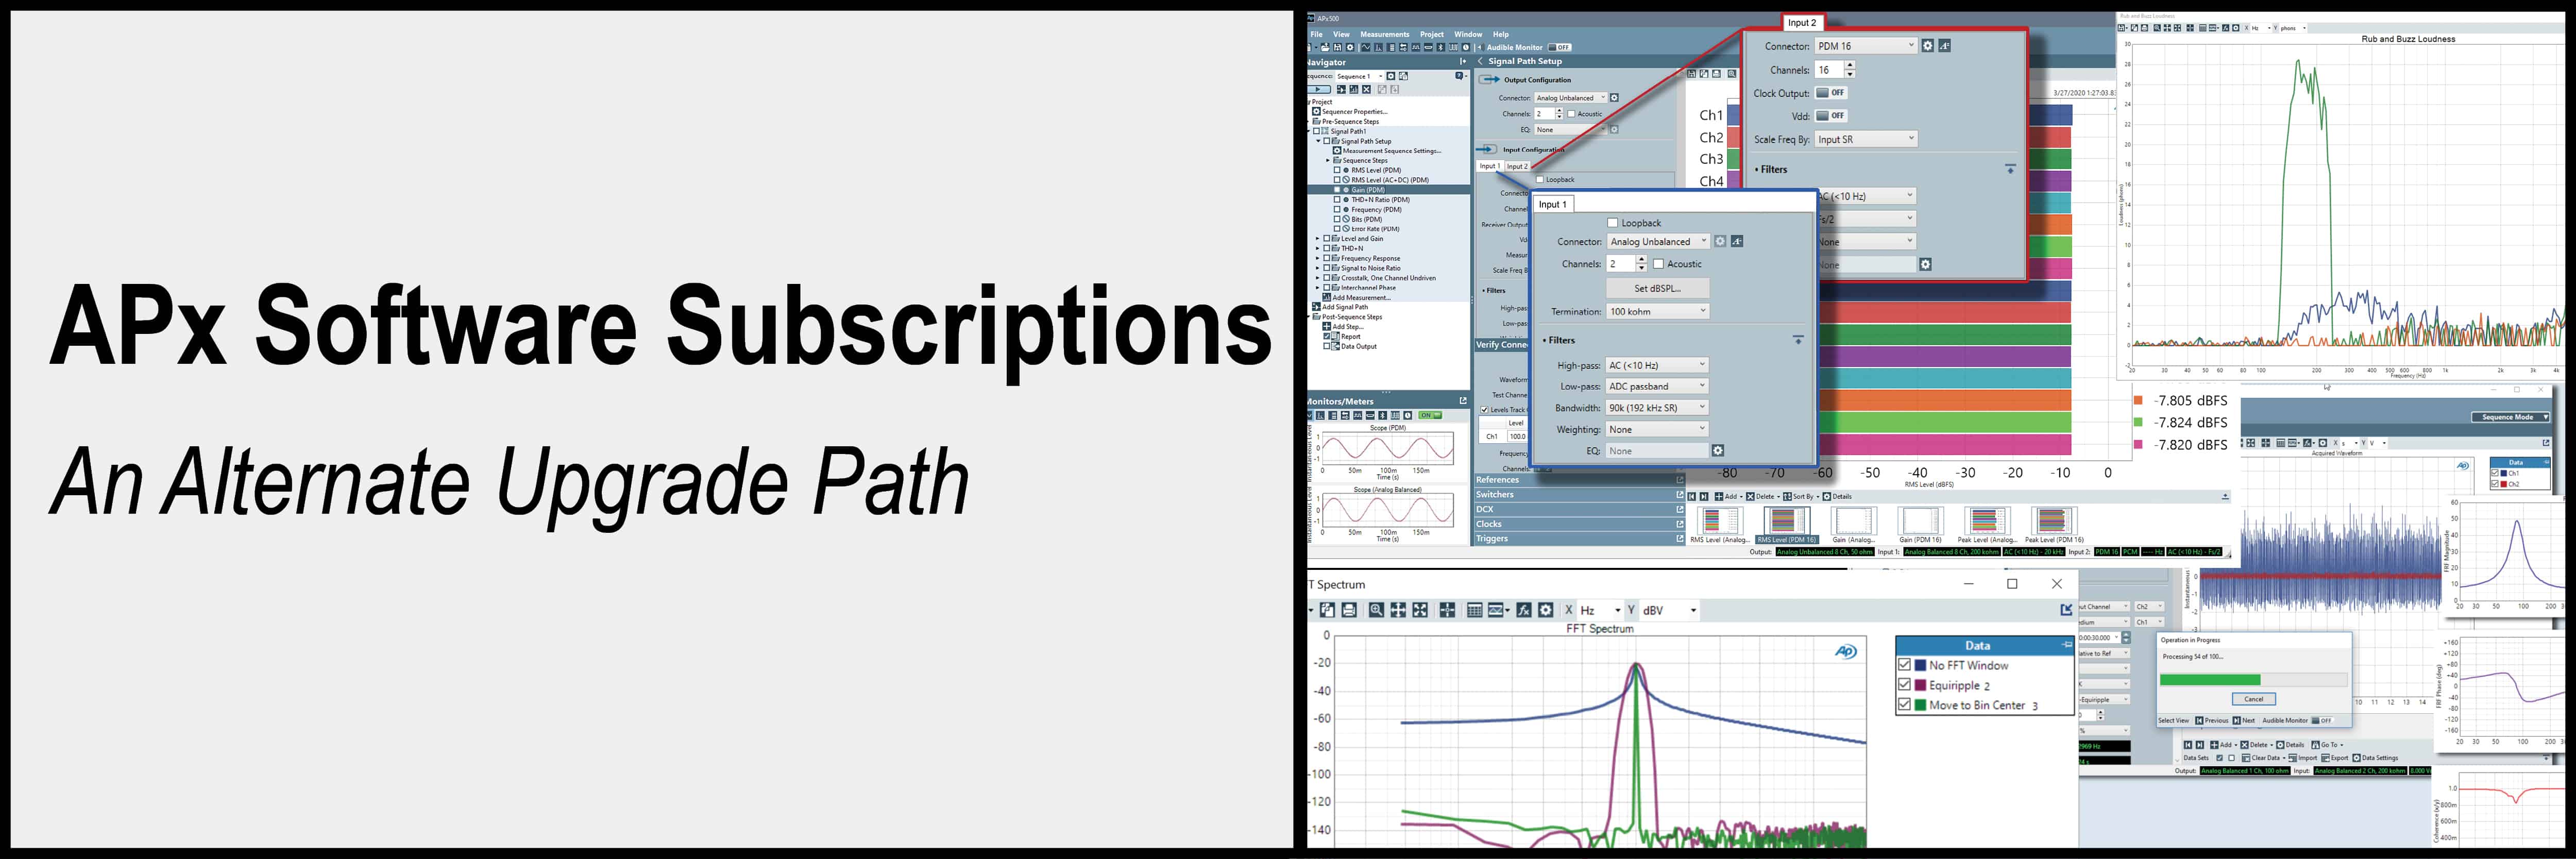
Introducing a new way to access all the latest APx500 software versions
Read more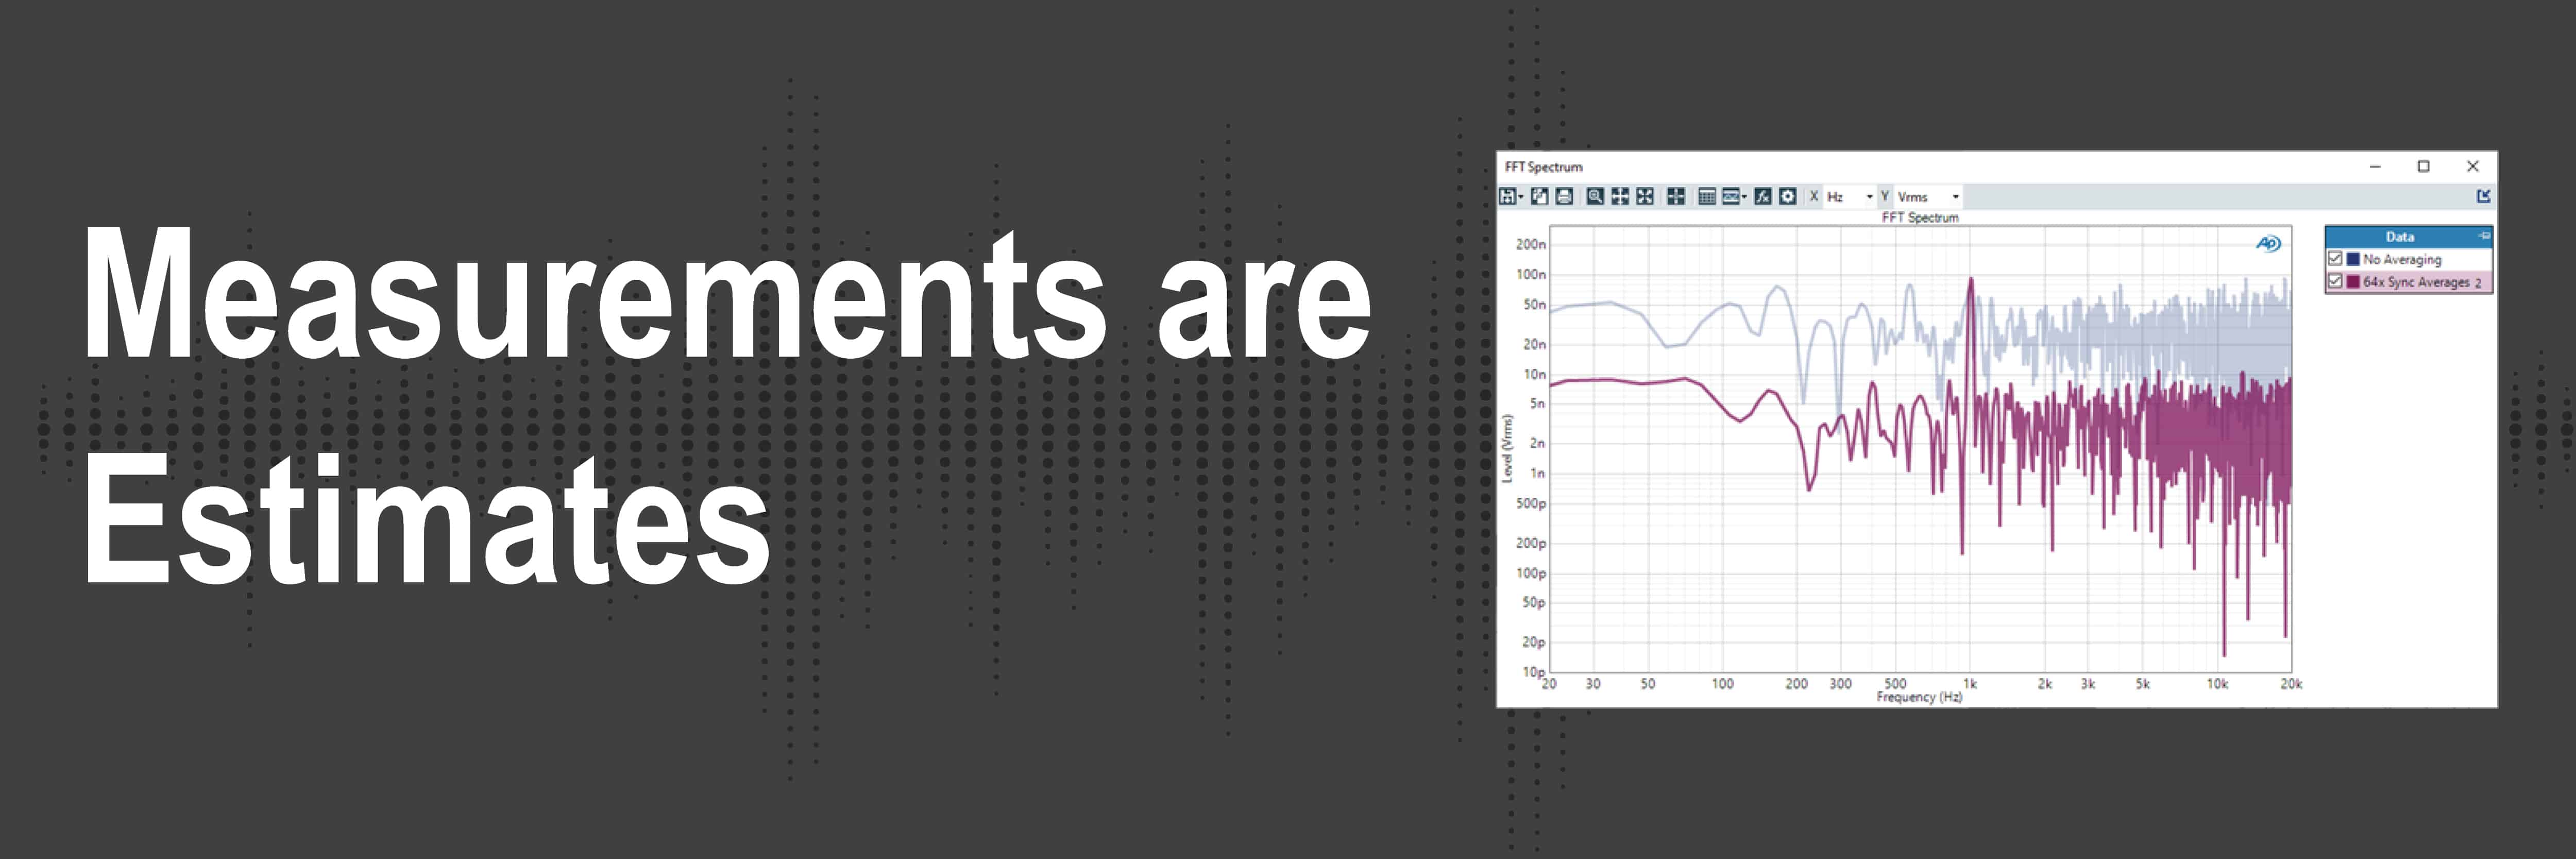
Understand how audio analyzers’ measurements are not absolute truths but are more so estimates.
Read more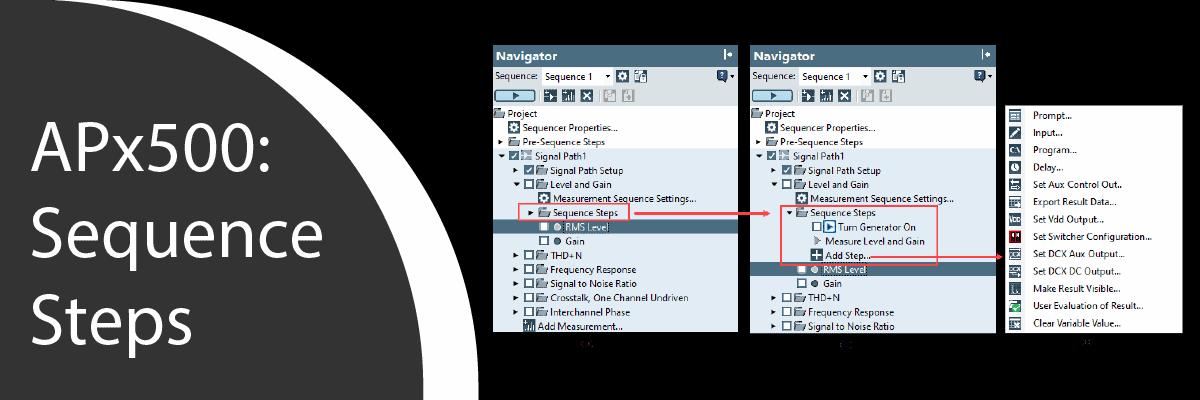
With its built-in test sequencer, reporting engine, and more, Sequence Mode in APx500 software can be very useful for a variety of applications.
Read more
Benchmarks. They are vital to ensure the R&D team produce a compelling new product or service and are essential on the production line of a manufacturing facility.
Read more