
In Audio Precision analyzers, FFT spectra are scaled so that the amplitude axis gives the correct reading for discrete tones. This makes sense, because most often we are characterizing the performance of a DUT using sine waves. The amplitude axis, however, cannot be used to indicate the level of a spectrally non-discrete signal, such as noise, without first applying a correction factor that depends on the FFT bin width and the window used.
The spectrum of a signal containing discrete tones combined with band-limited noise is shown in Figures 1 and 2. In Figure 1, the spectrum was measured without an FFT window (window = None). Note that the level of the band-limited noise is approximately equal to the level of the discrete tone at 1 kHz (0.0 dBr1).
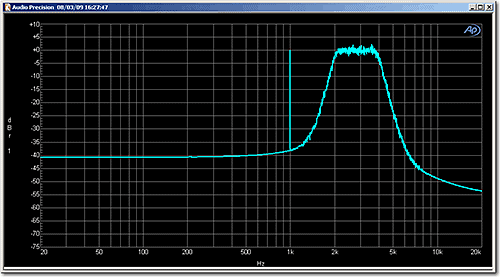
Figure 1. Spectrum of the test signal with window = None.
In Figure 2, the same test signal has been measured with a Hann window. In this case, the discrete tone at 1 kHz is still at 0.0 dBr1, but the level of the band-limited noise has increased by about 1.7 dB. This apparent increase in the noise level is due to the scaling applied by the SYS-2722 to correct for the Hann window. As noted, AP analyzers scale FFT results such that the amplitude axis gives the correct reading for tones. If the FFT had been scaled to give the correct reading for noise, then the level of the discrete tone would be -1.7 dBr1 and the band-limited noise would be at 0.0 dBr1.
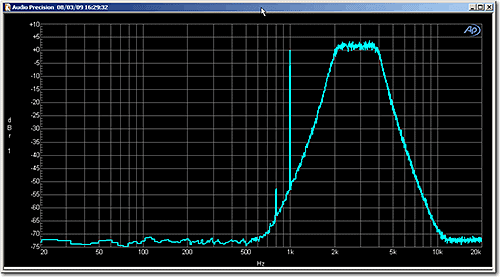
Figure 2. Spectrum of the test signal with window = Hann.
This effect of window scaling is also immediately apparent if you look at the spectrum of a noisy signal measured at two different FFT resolutions, as shown in Figure 3. In this case, the digital generator of a SYS-2722 has been connected via loopback to the digital input with the generator switched off, resulting in a signal containing only broadband noise due to dither. The cyan trace was plotted with an FFT length of 32 k (32,768), and the green trace with an FFT length of 256. If a horizontal line were drawn through the middle of each trace, one would be tempted to conclude that the apparent “noise floor” of the cyan trace is about -184 dBFS, and the green about -163dBFS.
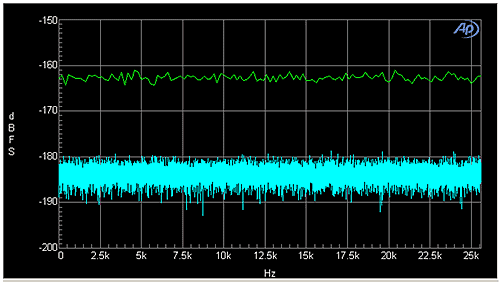
Figure 3. Spectrum of a noisy signal measured at two different FFT resolutions.
So how is it that the apparent noise level of the signal changes by as much as 21 dB, based on the FFT resolution alone? This difference is due to the fact that the measurement of noise depends on the bandwidth of the measurement. For a spectrum display that contains all of the bins in the underlying FFT, each bin represents the narrow band RMS level of the signal in that bin, equivalent to the level that would be measured by a bandpass filter with a bandwidth of Δf, the width of the FFT bin in Hz. Thus, the apparent noise floor of the spectrum depends on the bin width, or Δf, which in turn is a function of the number of FFT bins. Each time you double the number of FFT bins, the bin width is halved, reducing the “noise power” in each bin by a factor of 2. This equates to a 3 dB decrease in the RMS noise level. Therefore, in the example above, changing the FFT resolution from 256 to 32 k (a factor of 128, or 27) results in the RMS noise level in each bin being decreased by 3 dB x 7, or 21 dB.
Noise spectra are often displayed in a normalized format called power spectral density (PSD), or amplitude spectral density (ASD). This normalizes the data to the power spectrum (level squared) or amplitude spectrum that would be measured with a bin width of 1.0 Hz using a perfect bandpass filter centered at each point. In addition to compensating for the bin width (Δf), it corrects the spectrum for the scaling of the FFT window used. The spectrum from an AP analyzer can be converted to power spectral density using equation (1).
![]() ..........(1)
..........(1)
where Spectrum represents the FFT level spectrum, Δf is the bin width, and NoisePowerBandwidth is a correction factor for the FFT window used. The noise power bandwidth compensates for the fact that the FFT window spreads the energy from the signal component at any discrete frequency to adjacent bins. If the spectrum is in units of V, the PSD is in units of V2/Hz. In the digital domain, for a spectrum in units of FS, the PSD would be in units of FS2/Hz. Noise power bandwidths for windows commonly used in AP analyzers are listed in Table 1.
Table 1 Window Scaling Factors
| Window | Noise Power Bandwidth |
| Blackman Harris 3-term | 1.73 |
| Blackman Harris 4-term | 2.00 |
| Dolph-Chebychev 150 dB | 2.37 |
| Dolph-Chebychev 200 dB | 2.73 |
| Dolph-Chebychev 250 dB | 3.05 |
| Equiripple | 2.63 |
| Flat-top | 3.83 |
| Gaussian | 2.21 |
| Hamming | 1.36 |
| Hann | 1.50 |
| None (rectangular) | 1.00 |
| None, move to bin center | 1.00 |
| Rife-Vincent 4-term | 2.31 |
| Rife-Vincent 5-term | 2.62 |
The amplitude spectral density is simply the square root of the power spectral density (equation 2). For a spectrum in units of V or FS, it has units of V/√Hz or FS/√Hz, respectively.
 ..........(2)
The RMS noise level in any given spectral bandwidth can be determined by integrating the power spectral density over that bandwidth. For the entire bandwidth from DC to one half the sample rate (fS/2), the noise level is calculated by summing all FFT bins, as shown in equation 3.
![]() ..........(3)
..........(3)
When equation 3 is applied to the spectra shown in Figure 3, the calculated noise level across the entire spectrum is -141.5 dBFS for both the 32k and the 256 point FFTs. This compares well with the level measured using the audio analyzer’s RMS meter measurement.
The associated AP2700 macro file FFT_scaling.apb contains several functions that are useful for performing calculations on FFT spectra, including FFT spectrum integration with window correction. There is also a subroutine that will convert a measured FFT spectrum to amplitude spectral density in dB relative to 1.0 V/√Hz, or FS/√Hz,and plot it on the graph. The AP2700 test used to generate the graphs and data for this article (FFT_Scaling.at27) is also included in the download.
Figure 4 shows the noise floor of a DAC measured with a SYS-2722 and plotted as an ASD plot using the subroutine in the macro. If you use this subroutine to plot the ASD, change the graph’s Y-axis label back afterwards to its default value by right-clicking on it and selecting Auto-Label.
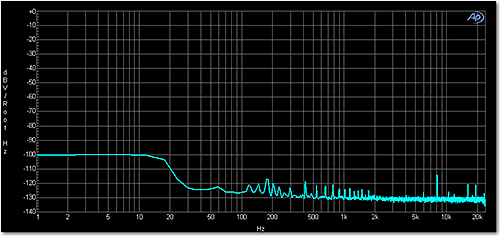
Figure 4 Amplitude spectral density plot of the noise floor from a DAC.
Reconciling a single-point RMS noise measurement with an FFT derived RMS noise measurement using APx500:
Let’s do a practical example that you can follow along with on an APx Series instrument, using the APx500 data export feature along with an Excel spreadsheet to make the calculations. For convenience, we’ll use the 24-bit digital noise floor as our noise source.
1. Put the system in digital loopback mode.
2. Measure the noise floor using the Level and Gain meter with the Lowpass filter set to None. This should give about -141.5 dBFS on both channels.
3. Add a Signal Analyzer measurement. Set the length to 1k, and the window type to None. Set the generator level to zero. Set the Y Unit to FS.
4. Hit Start. Right-click on the graph and choose Data/Export Graph Data. In the dialog, uncheck the Scope result and set Points to All Points. Click OK, name the file, and click Save.
5. Open the Excel file. In cell F5, type "=b5*b5". This computes the square (power) of the first FFT bin.
6. Highlight cell F5, press Ctrl-C to copy it, then highlight cells F5 to F517. Press Ctrl-V to paste.
7. In cell F519, type "=20*LOG10(SQRT(SUM(F5:F518)))". This computes the RMS value and displays it in dBFS. This also gives -141.5 dBFS.
We’ve just shown that the level measurement and the measurement derived from the FFT are the same when the window is set to None. Now, let’s proceed to show that it works for any window, if you have the right correction factor.
8. Set the window type to Hann and go through Steps 4-7 again. This should give about -139.7 dBFS.
9. As equation (3) shows, this value is high by the square root of the noise power bandwidth. We need to correct for that. Table 1 shows the value of the NPB for the Hann window (1.5).
10. Change cell F519 to "=20*LOG10(SQRT(SUM(F5:F518)/1.5))". (You could also put the value 1.5 in another cell and refer to that cell in the formula. This makes it easier to change the NPB if you change the window.) This gives -141.5 dBFS.
The numbers will change slightly from run to run—this is noise, after all—but the agreement will be very good if you do the computation correctly.