
Electro-Acoustic Test Options
APx audio analyzers are the preferred choice for designing and testing soundbars, pro-audio powered speakers, smartphones, hands-free devices and other products that integrate electronics and loudspeakers. For production test of drivers as well as finished products, manufacturers trust AP for the high reliability of our hardware and the ease-of-use of our software.
The electro-acoustic test software options for APx analyzers form a comprehensive solution, allowing designers and production engineers to test electro-acoustic products end-to-end. Measurements, results, reports and automation can be easily shared among platform family members, allowing designers and production engineers to collaborate and ensure quality, even when separated by great distances.
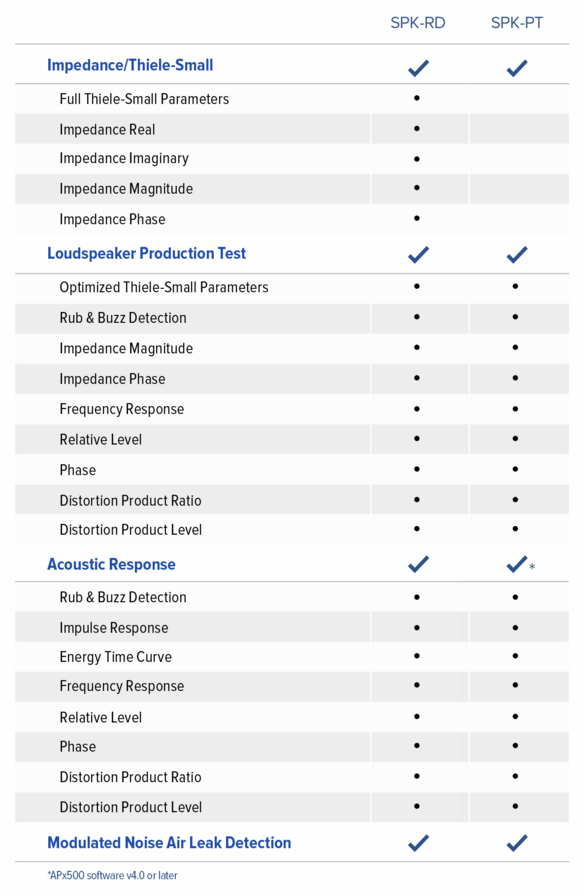
Research & Development
The APX-SW-SPK-RD option delivers a complete suite of measurements and results tailored to the needs of designers and engineers developing electro-acoustic audio products. It includes key measurements and results such as complete Thiele-Small characterization; time-gated, quasi-anechoic Acoustic Response; Impedance analysis; plus the Loudspeaker Production Test measurements.
Production
The APX-SW-SPK-PT option enables high-speed production test of electro-acoustic devices, providing key loudspeaker measurements in a single one-second sweep. Results include Rub & Buzz detection, essential Thiele-Small parameters, and impedance magnitude and phase. A proprietary modulated noise measurement is also provided to aid in detecting enclosure air leaks.
Measurement Microphones & Acoustic Test Accessories
For a wide range of acoustic testing hardware and accessories, Audio Precision recommends the products of our sibling company, GRAS Sound & Vibration. GRAS offers measurement microphones, power modules, acoustic test fixtures, and a variety of accessories that pair well with APx audio analyzers for acoustic testing applications.
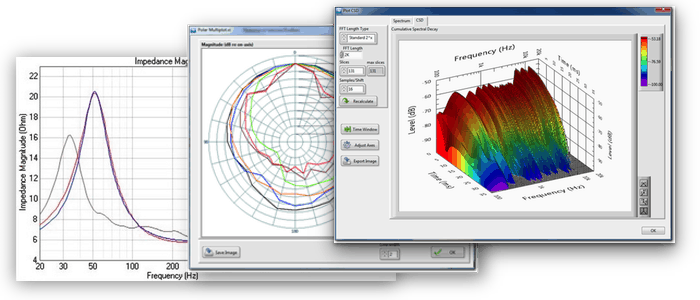
Waterfall and Polar Plots
AP’s waterfall and polar plots provide powerful visualization tools for understanding electro-acoustic behavior. The APx Waterfall Plot Utility creates three-dimensional graphs that display multiple curves of data that can represent changes over time or frequency. Spectrum or Cumulative Spectral Decay (CSD) views are available, with variable FFT length, number of slices and samples per shift.
The APx Polar Plot Utility displays the response of loudspeakers and microphones relative to position in a plane, and supports multiple brands of turntables to produce full circle, semi-circle, quarter-circle and custom plots.
NOTE: The APx Waterfall (CSD) Plot and APx Polar Plot Utilities are available for free download by registered AP.com users. However, both utilities require the SPK-RD software option be installed on the APx analyzer being used.
Perceptual Audio Test
APx PESQ and POLQA measurements test voice quality on mobile phones, VoIP networks, and hands-free devices. Tests return MOS (Mean Opinion Score) values with a high correlation to results obtainable using human subjects.