Detecting Glitches and Dropouts with APx500
Easily one of the most disturbing problems in digital audio playback systems are glitches and dropouts. What does it mean when a device drops a sample? It means that one sample is skipped, and the entire waveform is shifted left in time by one sampling instant, from that point forward. If a playback device drops audio samples, depending on the number of samples and where the drop occurs, the resulting discontinuity can cause a glitch, which might be very audible, and frankly, disturbing to listeners. It’s therefore not uncommon to want to verify that a device can playback a signal for an extended period. APx500 Software provides two distinct tools for doing this: in Sequence Mode you can use the Measurement Recorder and in Bench Mode you can use the Recorder.
Sequence Mode – Measurement Recorder:

Bench Mode – Recorder:

For the purposes of catching glitches and dropouts, we generally recommend using the Bench Mode Recorder. The sequence mode Measurement Recorder can also be used but overall the Bench Mode Recorder is superior.
To understand why, please refer to our previous article on Bench Mode compared to Sequence Mode, https://www.ap.com/blog/benchmode-vs-sequencemode/. In the context of Bench Mode Recorder vs Sequence Mode Measurement Recorder the difference can be quite stark.
The Sequence Mode Measurement Recorder functions by performing non-overlapped FFTS equal in length to the reciprocal of the selected reading rate. If a reading rate of 1 per second is selected, an FFT with a frequency resolution of 1 Hz is performed every second. A few important considerations for this technique bear pointing out immediately. First, since the FFT effectively performs an RMS average of the energy over the acquisition period as the reading rate goes down, the sensitivity to fast transients also goes down. Second, the acquisitions are not overlapped and the FFTs are windowed. Therefore, if a glitch were to occur right at the beginning or end of an acquisition interval, the windowing function would serve to attenuate or desensitize the measurement to it.
By contrast, the Bench Mode Recorder processes every audio sample through a digital simulation of a legacy analog measurement circuit, including even emulation of the overshoot and meter ballistics. While it is often desirable to suppress meter ballistics in order to return steady-state, settled, and repeatable measurement results, such is not the case when trying to detect glitches, dropouts, and other transients as these time-variant non-linear characteristics are desirable. Finally, by performing the analysis in the time domain, the effective reading rate can be much higher.
Let’s explore this with a practical example of a 1 kHz sine wave with an amplitude of -6 dBFS at 48 kHz sample rate. We created a signal that has a dropout once every second. For the first 10 seconds, the dropout is at the 0 crossing. For the next 10 seconds the dropout is at the peak of the sine wave.
RMS Level over Time – 2 Readings / Second – Sequence Mode and Bench Mode:

A single dropped sample represents very little energy to the total signal. Therefore, examining RMS level is not the best way to detect them. However here you can immediately see the contrast between Sequence Mode and Bench Mode. Sequence Mode is integrating the signal in 500 ms periods and a single dropped sample is simply averaged out. By contrast in Bench Mode even that single sample upsets the meter enough that it wobbles by a detectable, albeit small amount.
If we increase the reading rate to the maximum values, the difference becomes stark.
RMS Level over Time – 20 Readings / Second in Sequence Mode vs 250 Readings / Second in Bench Mode:
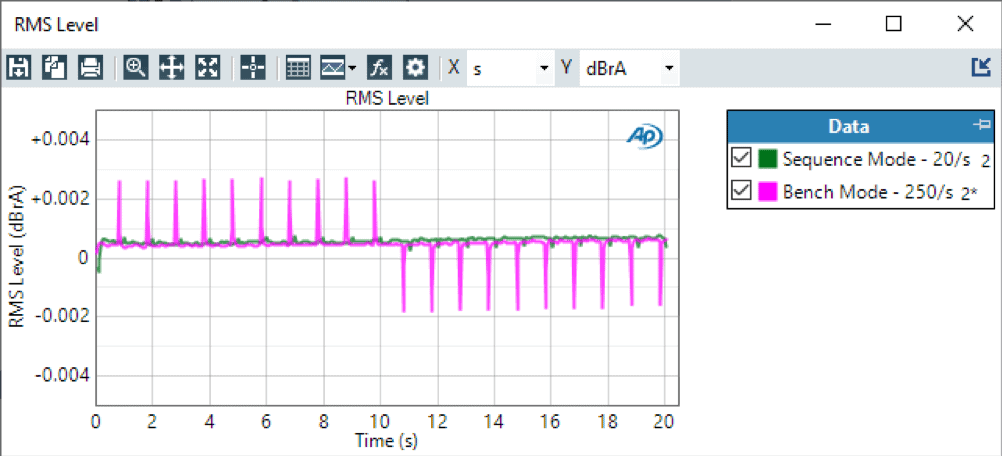
At the maximum reading rates supported by the two different modes, Bench Mode can pick out the glitches. The Sequence Mode results show some very small ticks, but a careless eye could easily mistake them for noise.
Generally, the best result to use when testing for glitches and dropouts is THD+N. A dropped or malformed audio sample is effectively an impulse. Audibly they sound like clicks. They produce a broadband response and as such will negatively impact the distortion of a device. So, with the same sample signal let’s explore THD+N.
THD+N Ratio over Time – 2 Readings / Second – Sequence Mode and Bench Mode:

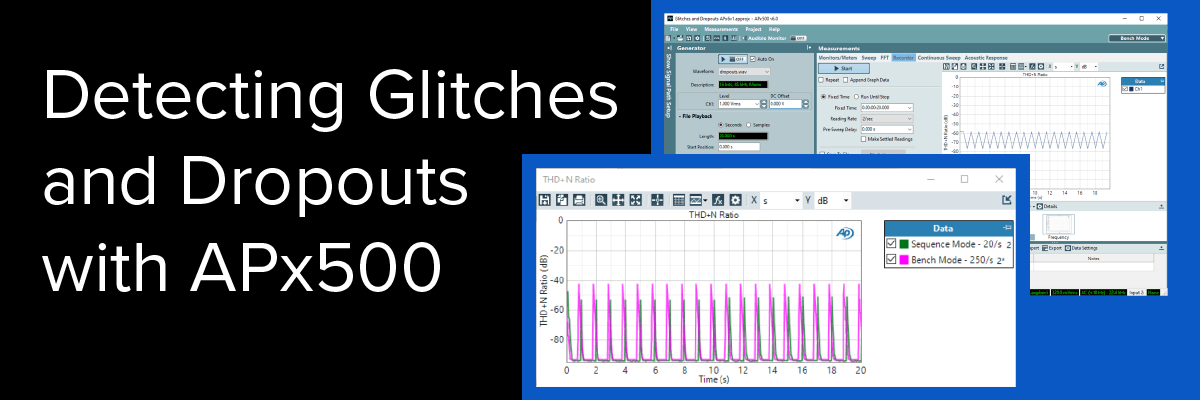
At this low reading rate, it’s interesting to contrast the two techniques with our knowledge of the test signal. In the first 10 seconds the glitch occurs at the 0 crossing while in the next 10 seconds it occurs at the peak of the sine wave. In Sequence mode the noise contribution when the dropout is at the zero crossing is averaged away by the 500 ms integration time. Sequence Mode can detect the dropout at the peaks of the sine wave because this has a much higher energy contribution. By contrast Bench Mode detects the dropouts at both the 0 crossings and the peaks of the sine wave.

At their respective maximum reading rates both Bench Mode and Sequence Mode can detect all the dropouts.
When trying to detect glitches and dropouts either Bench Mode Recorder or the Sequence Mode Measurement recorder can be used. However, the Bench Mode Recorder is more sensitive. When using either function, THD+N will be the result which is likeliest to show glitches. To maximize the sensitivity of the THD+N result, we recommend setting the Analyzer Notch Tuning Mode to Fixed Frequency and enter the pre-determined frequency of the test signal. In addition, if using the Bench Mode Recorder, make sure to uncheck the Make Settled Readings checkbox.
