
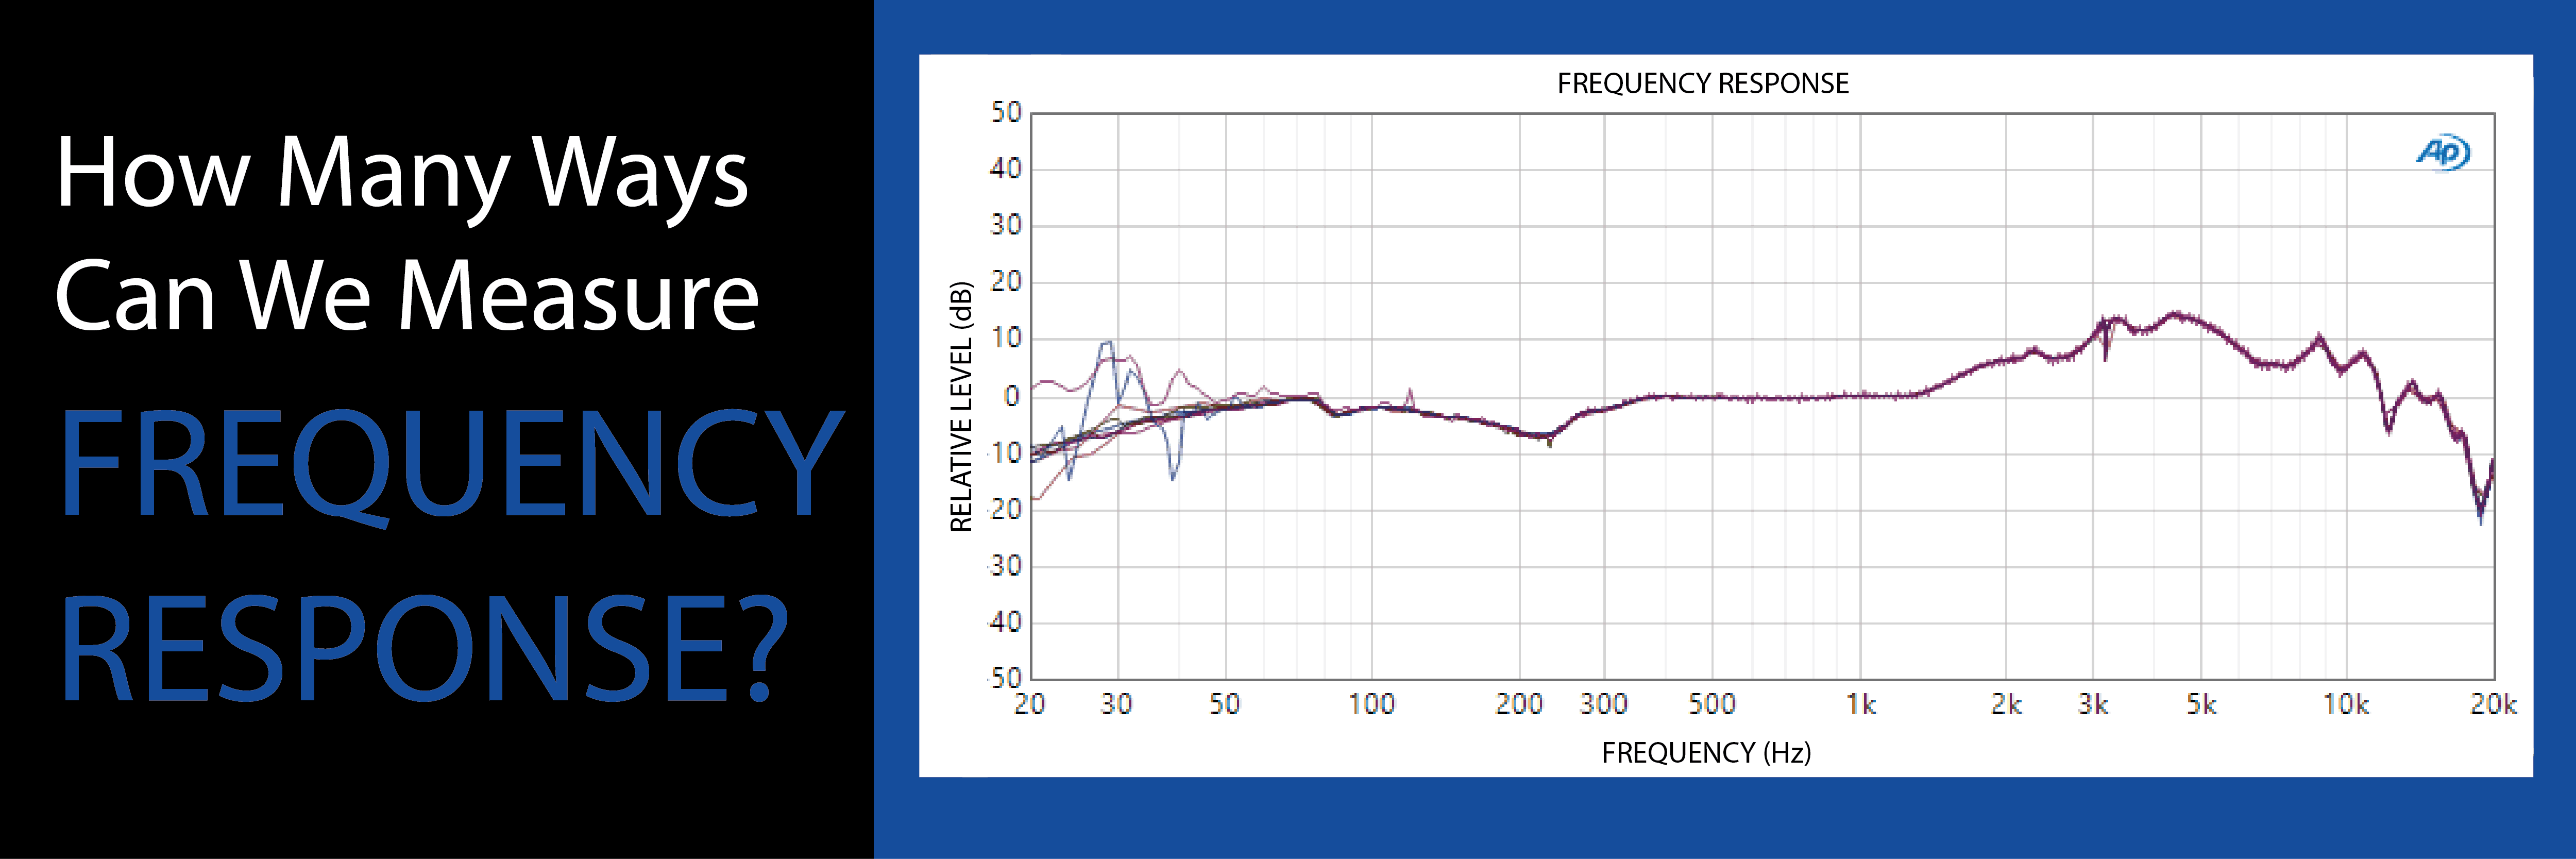
How Many Ways Can We Measure Frequency Response?
APx500 software provides many ways to measure frequency response, or the ability of an audio device to reproduce audio signals over a frequency range of interest. If you had to qualify an audio device with a single measurement, that measurement would likely be frequency response. Since this is such a fundamental metric, our software provides many ways with which frequency response can be measured.
Listed below are at least 10 ways to measure frequency response, followed by brief descriptions of why each might be used:
- 1. Frequency Response
- 2. Continuous Sweep
- 3. Acoustic Response
- 4. Loudspeaker Production Test
- 5. Stepped Frequency Sweep
- 6. Bandpass Frequency Sweep
- 7. Multitone
- 8. Transfer Function – White Noise signal
- 9. Transfer Function – Speech signal
- 10. Signal Analyzer (FFT) – White Noise
In this graph, you can see the frequency response of a headphone driver as measured using each of these techniques:
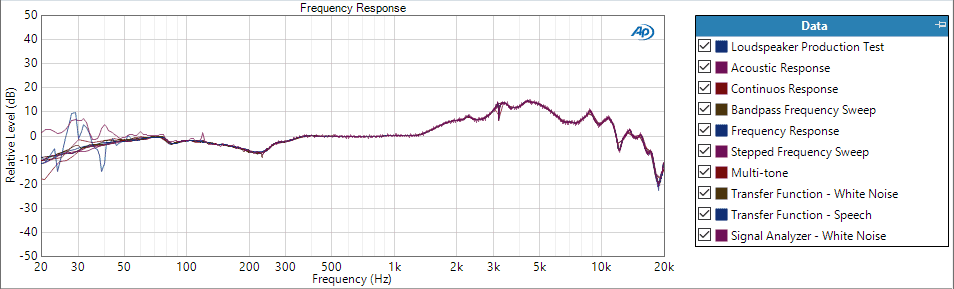
Figure 1: Frequency Response in APx500 Software
The first four of these techniques all use the same signal processing technique. Frequency Response, Continuous Sweep, Acoustic Response, and Loudspeaker Production Test are all based on the exponential sine sweep, or chirp, technique pioneered by Angelo Farina in 2000.
Frequency Response provides the simplest controls and the simplest results. If you are just looking to quickly find the frequency response of a device, then this is the measurement for you. As it is based on our chirp signal, it is exceptionally fast, providing results in as little as a fraction of a second. However, it only provides frequency response.
Continuous Sweep expands beyond Frequency Response. In addition to the results provided by Frequency Response, it adds Phase response, various ways to observe distortion, the ability to view the Impulse Response of the device under test, and uniquely to Audio Precision, we also can find the crosstalk of the device as a function of frequency. Continuous Sweep provides all these results from a very fast chirp stimulus signal
Acoustic Response and Loudspeaker Production Test build upon Continuous Sweep by adding features and results useful in situations where acoustic transducers, speakers or microphones are being measured. First, both acoustic response and loudspeaker production test allow you to apply a time window, or gate, to the impulse response. This can be used to window out the acoustic reflections that occur when making measurements in a non-anechoic space. In addition, they add Rub and Buzz results, a characteristic of electrodynamic speaker drivers.
Loudspeaker Production Test is further optimized by adding the ability to measure not just the frequency response, distortion, phase response, impulse response, and rub and buzz of a speaker, but also adds the impedance response and Thiele-Small parameters of a speaker, again using the chirp stimulus signal.
Stepped Frequency Sweep is perhaps the most classic way to find the frequency response of a device. A sine wave is generated and swept from one frequency point to the next. In APx500 software, this measurement can return the frequency response, THD+N (distortion and noise), THD (distortion only), and phase response of a device. Compared to measurements that use a chirp, stepped sweeps are quite slow. However, they are the only solution for measuring distortion and noise as a function of frequency. In addition, stepped frequency sweeps are simply the de facto standard for many devices and for comparison purposes it is often required to use this measurement.
Bandpass Frequency Sweep is also a stepped sine sweep measurement, yet in this measurement context a filter with potentially high-selectivity can be used to track the fundamental stimulus signal. This can be useful particularly when measuring acoustic devices. The Stepped Frequency Sweep measurement is making a broadband or unfiltered response measurement. Noise and distortion are included in the result. The Bandpass Frequency Sweep, especially when using the highest selective mode, “window width”, can exclude these unrelated signals.
Multitone Analyzer uses many tones but instead of discretely sweeping from one tone to the next, it plays all the tones simultaneously. A multitone sounds like an organ where someone is holding all the keys down simultaneously. The advantages of a multitone are that it can be very fast like a chirp-based measurement but at the same time it can also measure noise and other non-harmonically correlated signals like a stepped frequency sweep. The disadvantages of a multitone are that the crest factor is much higher than a pure sine wave and that the noise result, TD+N (Total Distortion and Noise), is not the same as THD+N (Total Harmonic Distortion and Noise) because it include harmonic distortion and intermodulation distortion products. This makes it non-trivial to compare TD+N and THD+N results.
Transfer Function provides a very interesting alternative for measuring the frequency response of a device. All the measurements previously described rely on using a sinusoidal stimulus. This can be a problem because many modern communication devices, such as mobile handsets, include adaptive signal processing algorithms that try to cancel sine waves and other signals that are not speech. That makes finding the frequency response of a mobile phone, or the microphone embedded in a smart speaker, misleading at best and futile at worst. Transfer function works by finding the correlation between the source or stimulus signal and the response signal. The signals can be completely arbitrary. The only requirement for transfer function is that the stimulus signal must have energy in the frequency range of interest. Broadband noise is a great signal for test, but more usefully, recordings of actual human speech can be used. When using speech signals, it is important to recognize that actual human speech does not usually have much energy content below 100 Hz or above 4-10 kHz. In addition, you must typically average over many seconds of speech in order to make a useful measurement.
Signal Analyzer is not normally thought of to make a frequency response measurement, but it can be used that way. If you play back a white noise signal (equal energy per frequency) you can read the frequency response directly from the FFT spectrum. It may require a lot averaging but a device with a flat frequency response will have a flat spectrum.
With all of the above measurements described, here are a few final things to keep in mind when measuring frequency response:
On resolution – the above measurement techniques also breakdown along the line of resolution. All chirp-based measurements, and Transfer function, provide very high measurement resolution, with thousands of measurement points being returned in relatively short measurement times. Stepped frequency sweeps and Multitone cannot practically provide more than 100 or so measurement points.
On noise immunity – Chirp-based measurements, Multitone, and Bandpass Frequency Sweep provide high immunity to uncorrelated noise. This is can be quite helpful when, for example, measuring speakers in less-than-ideal acoustic environments. Stepped Frequency Sweeps, Transfer Function, and Signal Analyzer do not exclude noise from the measurement and the results can be biased by the presence of environmental noise, especially when making acoustic measurements.
On measurement speed – For finding just the frequency response of a typical device, likely no technique is faster than the chirp embodied in Frequency Response, Acoustic Response, Continuous Sweep, and Loudspeaker Production Test. Multitone is the second fastest technique which need only be 100 milliseconds or so slower than a chirp. Stepped Frequency Sweep, Bandpass Frequency Sweep, Transfer Function, and Signal Analyzer will be the slowest measurement techniques.
Benchmarks. They are vital to ensure the R&D team produce a compelling new product or service and are essential on the production line of a manufacturing facility.
Read more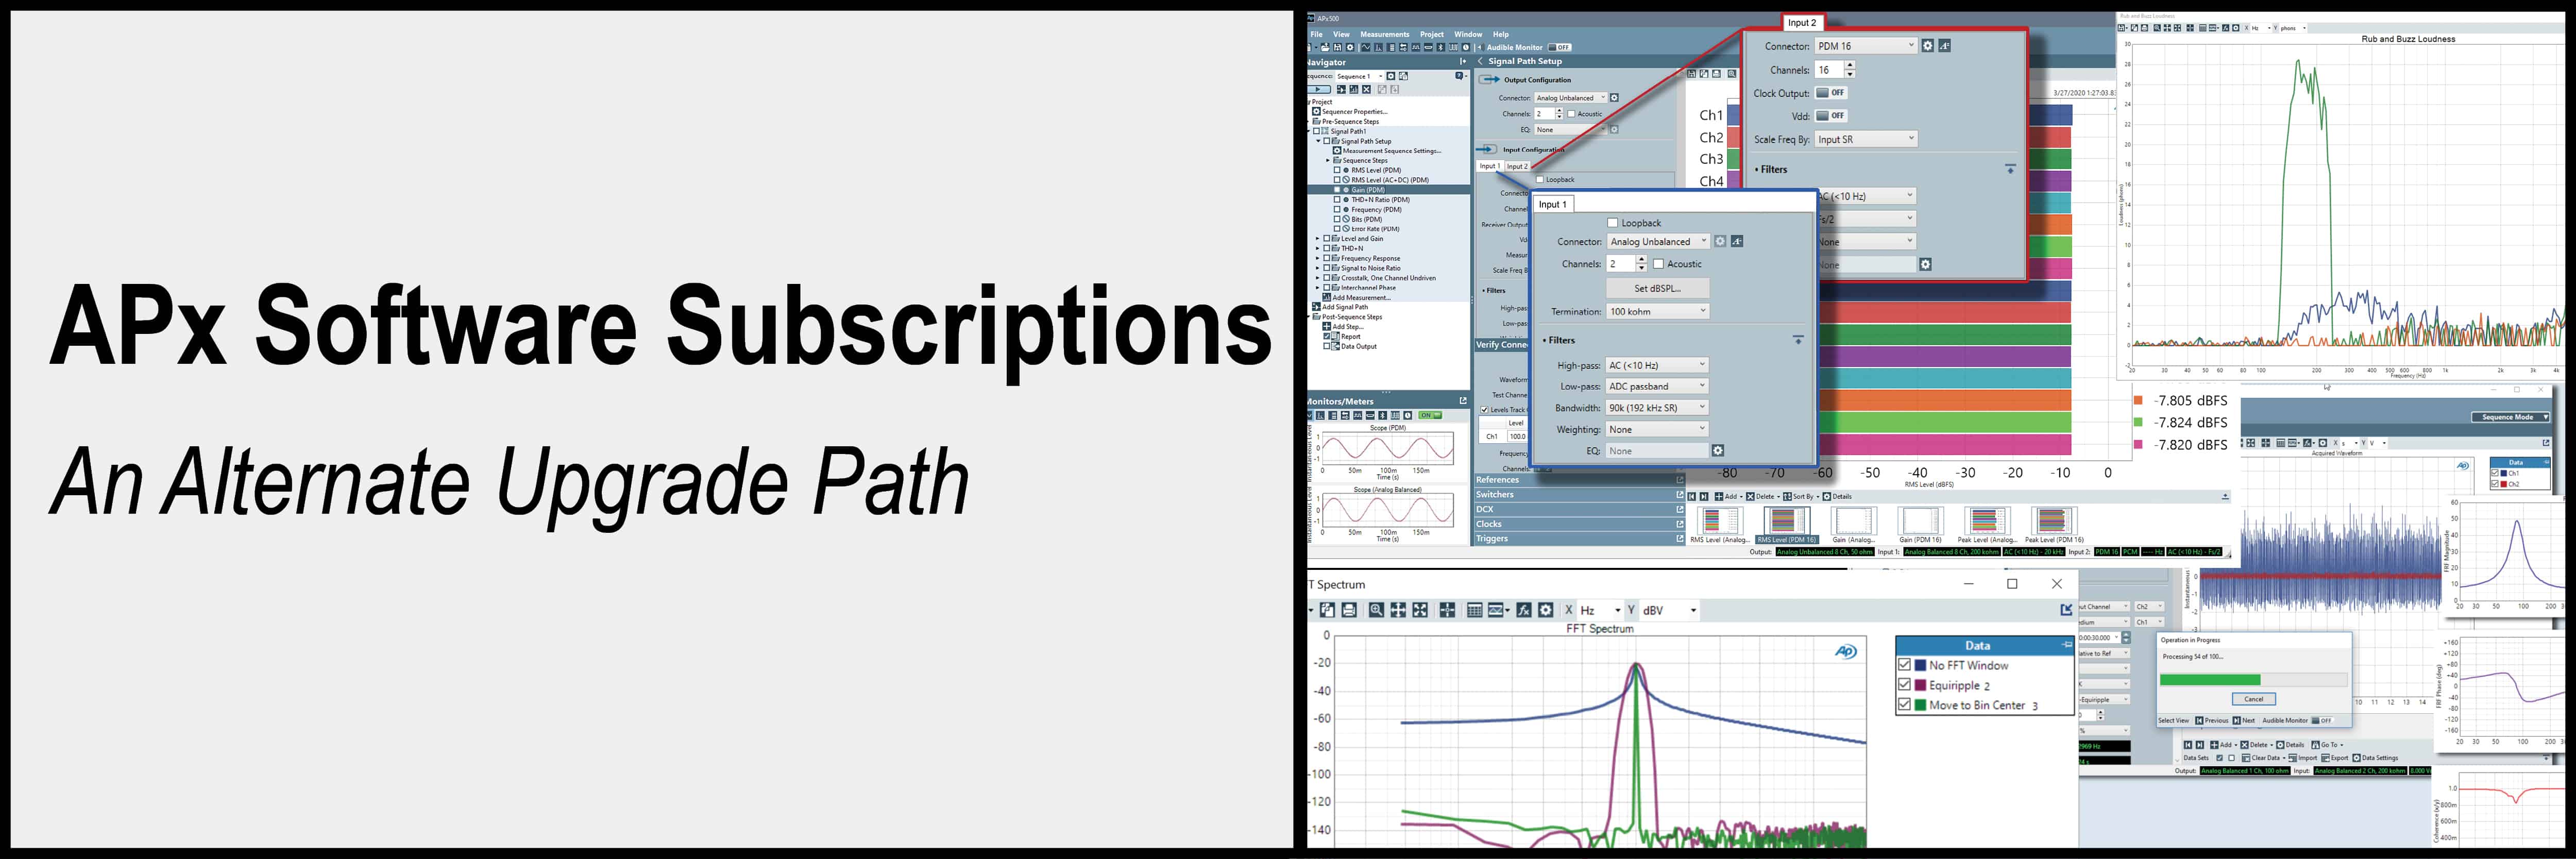
Introducing a new way to access all the latest APx500 software versions
Read more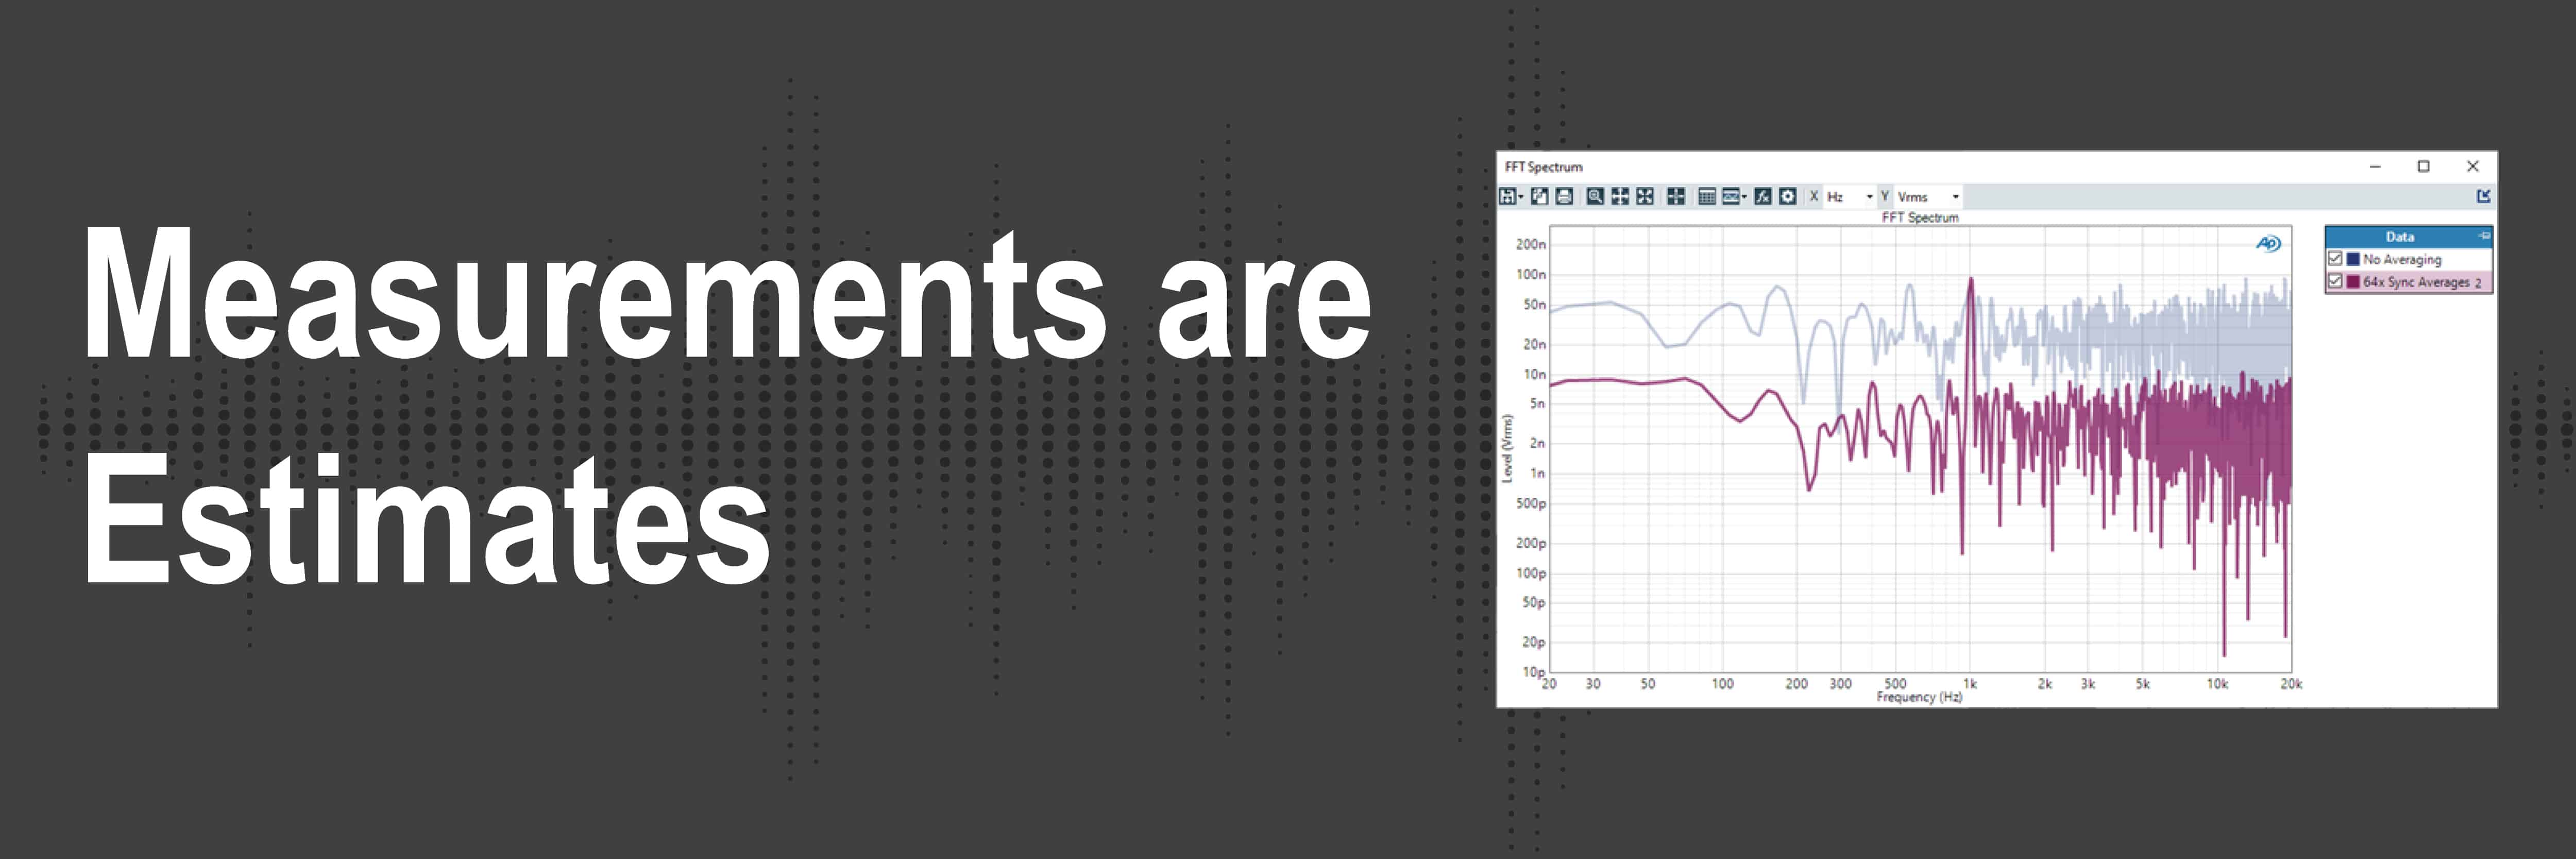
Understand how audio analyzers’ measurements are not absolute truths but are more so estimates.
Read more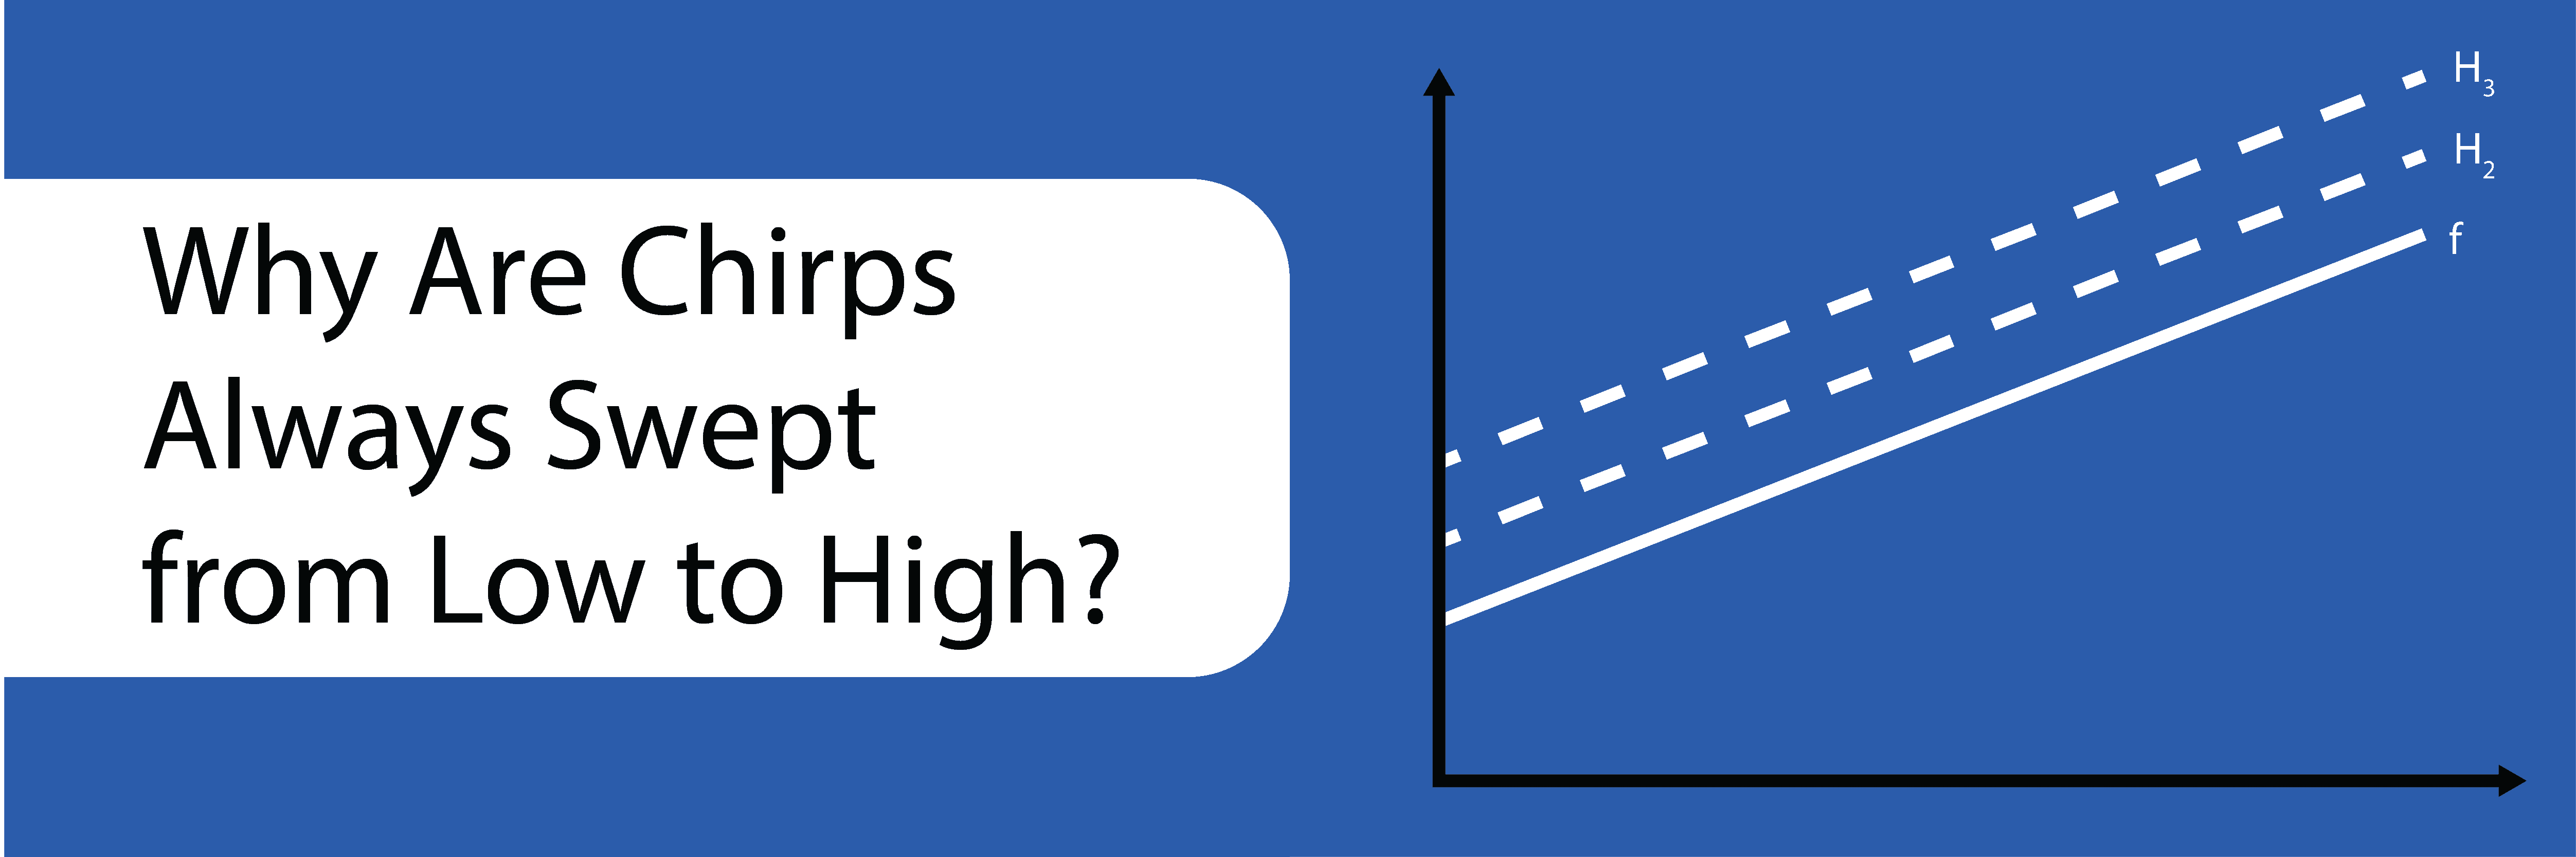
If you look at any APx measurement using a log-swept sine stimulus (a chirp), you might notice that the signal is always swept from low to high frequency. Learn more about why chirps are always swept from low to high.
Read more