
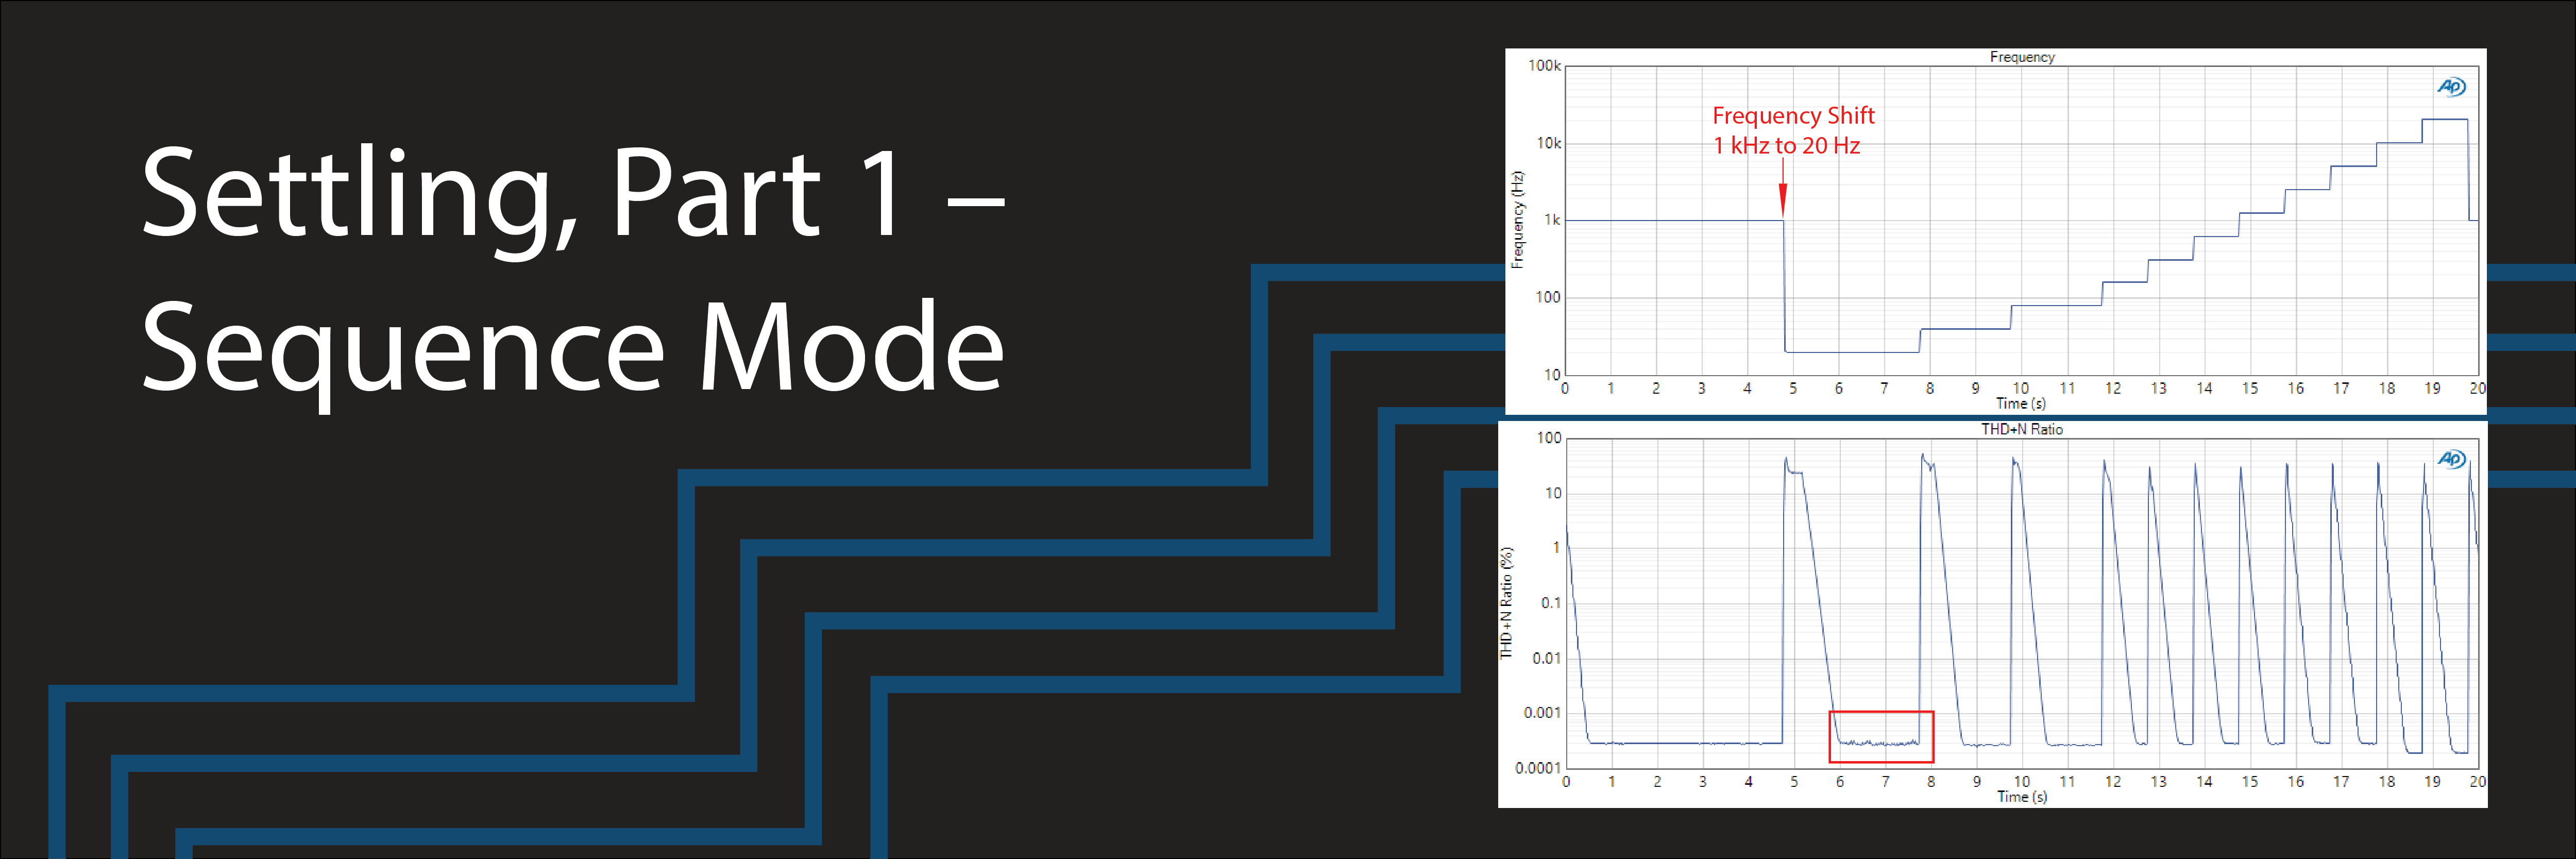
Settling, Part 1 – Sequence Mode
In this two-part series, we’ll review the features available in APx500 software to help ensure that settled readings are acquired when testing audio devices. This post covers settling in Sequence Mode. Part 2 will cover settling in Bench Mode.
Meter Readings
In APx software, both Bench Mode and Sequence Mode have measurement meters which return readings of metrics like RMS Level, THD+N, Frequency, etc., but the method used to derive these meters from the raw input samples is fundamentally different between the two modes. In Sequence Mode, almost every result is determined via FFT analysis, whereas Bench Mode results are implemented as digital filters applied in the time domain. Each method has its own merits, but one consequence of this is a difference in reading rates. As we’ll see below, Bench Mode can deliver reading rates as high as 250 readings per second, whereas in Sequence Mode, reading rates are limited to 20 readings per second or lower.
About Settling
Testing an audio device usually involves stimulating it with a high-quality signal, often a sine wave, then measuring the quality of the signal that comes out of the Device under Test (DUT). Whenever the stimulus signal changes in frequency or amplitude, signal transients can be introduced by one or more in-circuit components (e.g., the DUT itself, the signal generator, the analyzer input section, etc.). To make good, repeatable audio measurements, we need to ensure that audio quality metrics are captured under steady state conditions, once these transients have dissipated and the meters have settled.
Consider the plots in Figure 1, showing Frequency and THD+N Ratio versus time as measured using the Bench Mode Recorder measurement at 250 readings per second for an APx555 in analog loopback. In this case, the stimulus was a .wav file created by the APx Waveform Generator Utility containing an 11-point stepped frequency sweep from 20 Hz to 20 kHz. This signal, which is intended for open loop testing, has a 1 kHz pilot tone at the beginning, for triggering. As shown in Figure 1, every time the frequency changes abruptly, the measured THD+N spikes to 30% or higher, then gradually settles down to its steady state value of about 0.0003% after one to two seconds. Figure 2 is a zoomed-in plot of the section of the curve highlighted in Figure 1, after the frequency abruptly changed from 1 kHz to 20 Hz. In the Figure 2 plot, the individual reading points, spaced 4 ms apart, are shown.
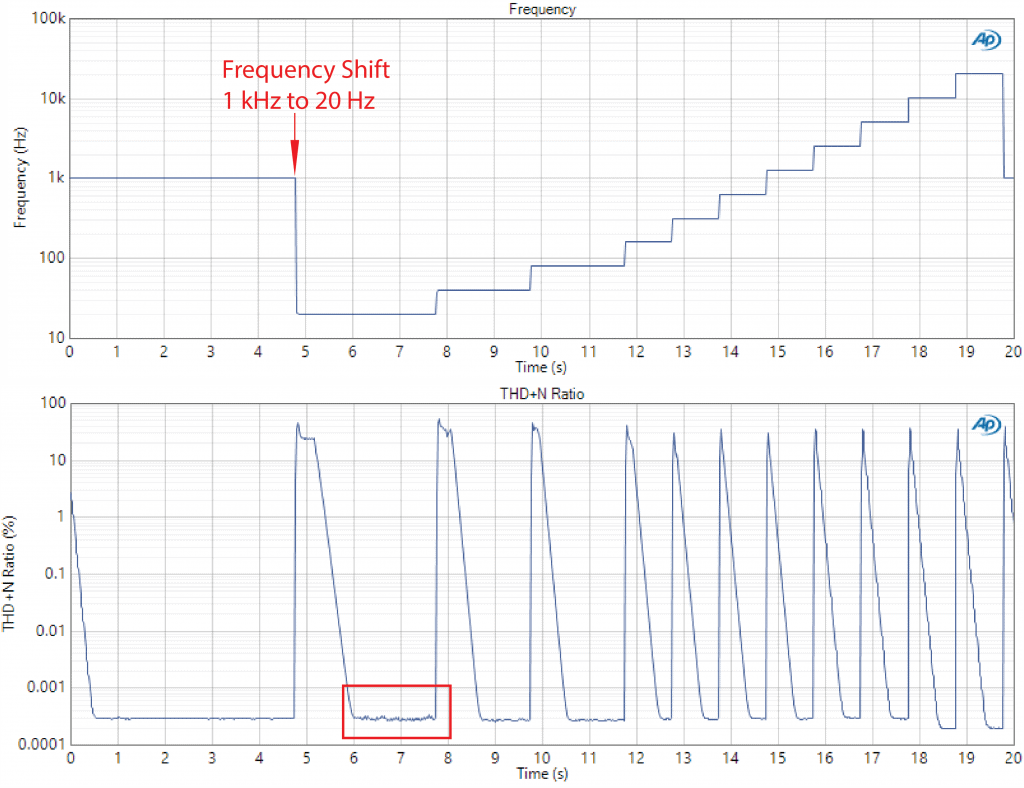
Figure 1. Frequency and THD+N Ratio versus time, measured on an APx555 when stimulated with an 11-point frequency sweep from 20 Hz to 20 kHz at 1.0 Vrms.
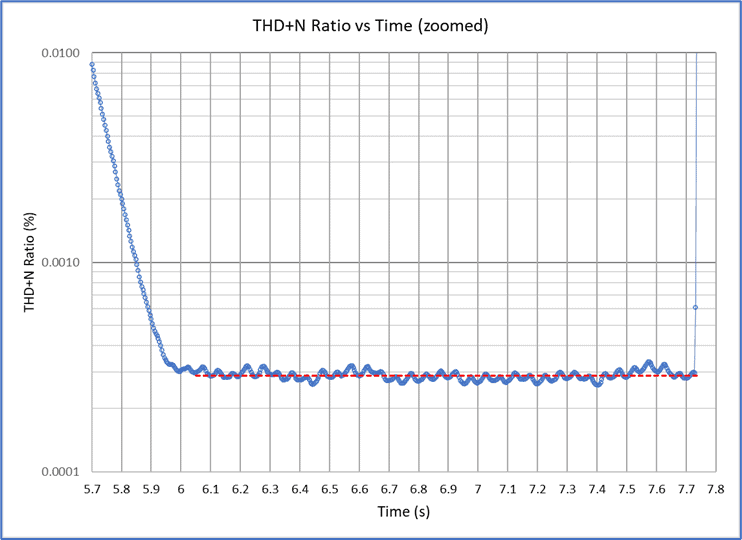
Figure 2. Zoomed in portion of the THD+N vs time plot highlighted in Figure 1.
We want to ensure that we sample the THD+N meter after the transient spikes have dissipated and the circuit is in a steady state condition. The settling algorithms in the APx500 software provide the tools needed to do so. And for closed loop testing, settling enables efficiency, because once a settled reading has been acquired, the analyzer can tell the generator to move on to the next step in the sweep.
Settling Parameters in Sequence Mode
In Sequence Mode, each measurement has its own settling parameters. Settling controls are located on the Settling tab(s) of the Signal Acquisition and Analysis dialog, which is opened by clicking the “Advanced Settings…” button below the Analyzer section in the measurement’s configuration pane. For example, Figure 3 shows the THD+N measurement’s settling parameters for the two settling algorithms available in Sequence Mode: Flat and Average. Note the Enable Settling checkbox, which is used to select whether settling is enabled (default) or disabled.
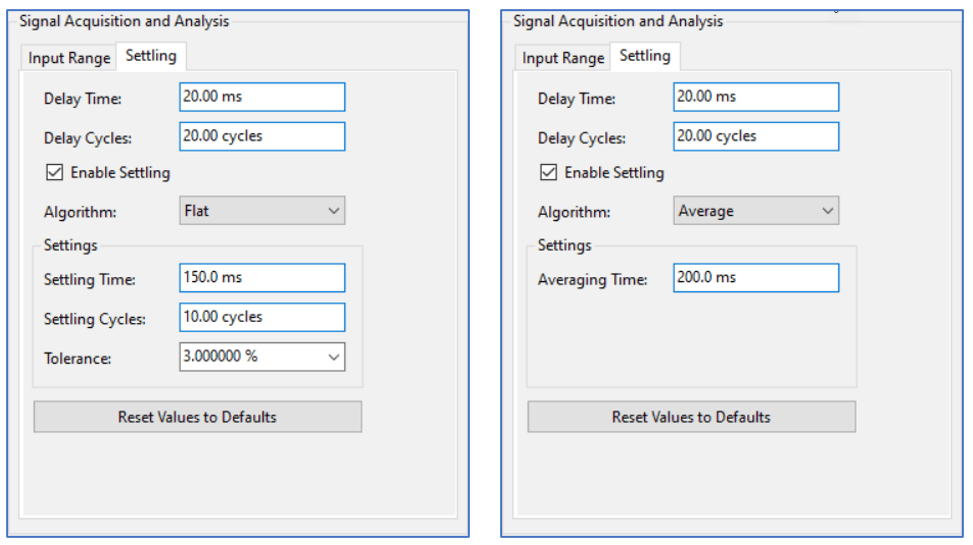
Figure 3. THD+N measurement settling parameters for the Flat (left) and Average (right) algorithms.
Both settling algorithms have a Delay Time and Delay Cycles control. These are used to set the amount of time that the system waits before even attempting to find settled readings. To put this in context, consider the THD+N versus Time graph for the stepped frequency sweep in Figure 1. At the beginning of each sweep step, when the frequency abruptly changes, there is a large spike in the THD+N ratio that takes at least one second to dissipate. In this case, it would be appropriate to set the Delay Time to 1.0 seconds.
The Delay Cycles control is used to specify the delay in cycles of a sine wave instead of time. The system takes the greater of the Delay Time and the Delay Cycles converted to time as the actual delay. For example, the default settings are Delay Time = 20.0 ms and Delay Cycles = 20.0 cycles. At a frequency of 20 Hz, the duration of 20 cycles is 20 x (1/20 Hz) = 1.0 seconds. Hence the system would wait 1.0 seconds at 20 Hz. However, at 20 kHz, where a 20-cycle period has a duration of 1.0 ms, the system would take the Delay Time of 20 ms as the actual delay.
Flat Settling Algorithm
The Flat algorithm considers a series of sequential readings within a specified time window looking backward from the most recent reading. The width of the time window is the greater of Settling Time and Settling Cycles. When all the readings in the time window are within ± t of the most recent reading, where t is the value specified in the Tolerance field, the measurement is considered to have settled and the last reading is taken as the settled reading.
Average Settling Algorithm
The Average algorithm simply computes the average value of all readings within the specified Averaging Time. This algorithm works well for signals that are inherently noisy. For example, it is the default settling algorithm for measurements like Noise (RMS).
Timeouts
For the Flat Settling algorithm, timeouts may occur if the signal is too noisy or unstable, or if the settling parameters are not set appropriately. In Sequence Mode, if the Flat algorithm fails to find a settled reading within 10 adjacent time windows (as defined by Settling Time/Settling Cycles controls), a settling timeout occurs. In this case, the system returns the average of all readings from the last five time windows, and marks the point on the sweep graph with a "T" symbol, as shown in Figure 4.
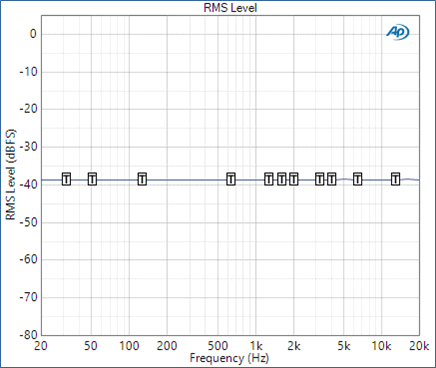
Figure 4. A Stepped Frequency Sweep RMS Level result with Timeout symbols at many frequencies.
Live Meter Measurements in Sequence Mode
Several meter measurements in Sequence Mode (e.g., RMS Level, THD+N, Noise [RMS], etc.) are live meters, meaning their bar graphs are continuously updating. These measurements typically have a Generator On/Off button. To get settled readings from these live measurements, they must be run from the Sequencer (using the Run Sequence button or the Run Selected Measurement context menu), which causes the settled readings to be rendered in the report.
Measurements with Multiple Results
Note that measurements with multiple results will have separate settling parameters for each meter. For example, Stepped Frequency Sweep has settling parameters for RMS Level, RMS (AC+DC), THD+N and Phase (Figure 5). Settling is enabled by default on all meters, and the default settings work well for most applications, but to be as efficient as possible, you should disable settling for meters that you don’t care about. For example, if you only want RMS Level vs Frequency, disable settling for all the other meters and the measurement might well proceed faster.
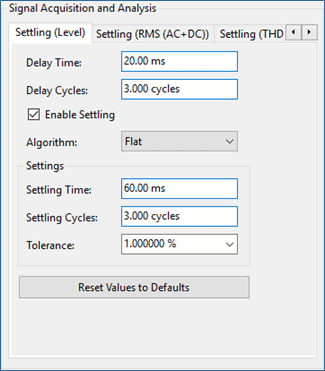
Figure 5. Signal Acquisition and Analysis dialog for the Stepped Frequency Sweep measurement.
If you’re having trouble getting settled readings in Sequence Mode, or you just want to see what’s going on “under the hood”, the Recorder measurements (especially Bench Mode with its reading rate of up to 250 per second) can be very useful for troubleshooting settling issues. Armed with graphs like Figure 1, it’s easy to see what is appropriate for an initial delay and to get an idea of the appropriate settling time or (averaging time).
These two modes of operating the APx500 software represent not just two different approaches to how the software is used, but also two different signal processing approaches.
Read more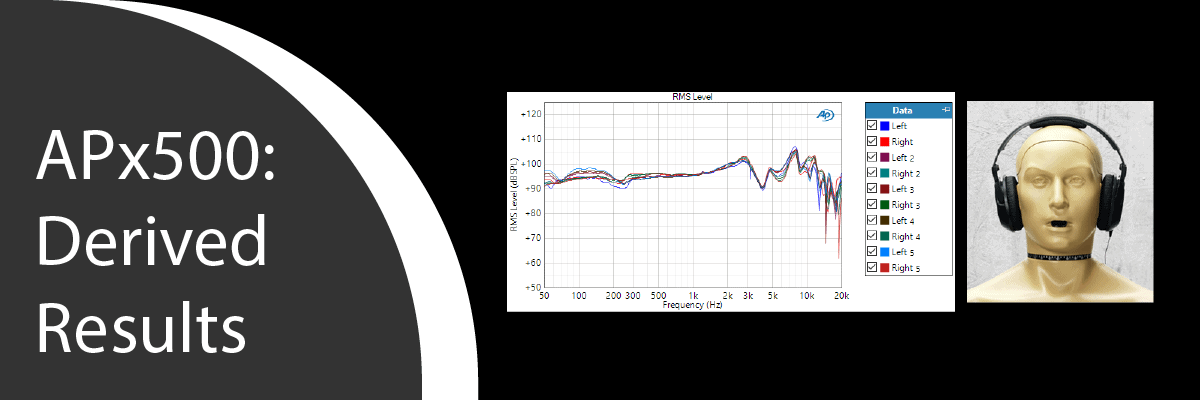
In this post, we discuss Derived Results in the APx500 software, another useful capability to help satisfy your audio test needs.
Read more
New Video! Mike Martin walks through key loudspeaker test methods, typical test setups and then demonstrates a variety of measurements.
Read more
New Video! In this session, Joe Begin provides a detailed discussion of how to use a variety of automation and production (or manufacturing) test-oriented features.
Read more