
Created on 2015-08-18 20:52:00
This article explains the difference between the APx software's Continuous Sweep and Stepped Frequency Sweep measurements when measuring frequency response near the cutoff frequency of a Digital-to-Analog converter. The frequency response of the converter is affected by alias products that may occur in the output of the converter when the test frequency approaches the cutoff frequency (also called the folding frequency in reference to these alias products).
A Continuous Sweep is fast and provides high-resolution frequency response information, but is designed to measure only the swept fundamental and harmonics of that fundamental. It cannot measure other signals indirectly related to the fundamental, such as alias frequencies near the folding frequency of a D-to-A converter. This may be a desired result for certain test cases. Typically the test engineer wants to measure alias products or interference signals in addition to the fundamental in a frequency response measurement.
The Stepped Frequency Sweep measurement is considerably slower in comparison to a Continuous Sweep measurement but measures all in-band signals including the fundamental, interference signals, noise, and alias products. This may produce a different frequency response curve than the Continuous Sweep method.
APx can acquire both response curves and plot the difference if desired. Figure 1 shows frequency response curves measured by the two measurement methods. The two curves are identical below 22.5 kHz. The blue Continuous Sweep curve shows a lower response above 22.5 kHz, representing the amplitude of the fundamental only at the swept frequency. The red Stepped Frequency Sweep curve has a higher response level, indicating the presence of other signals created by the converter at frequencies above 22.5 kHz.
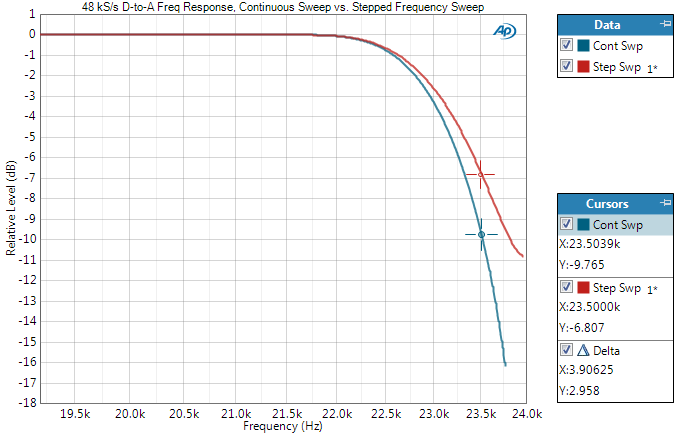
Figure 1 shows Continuous Sweep and Stepped Frequency Sweep response measurements of the same Digital to Analog converter.
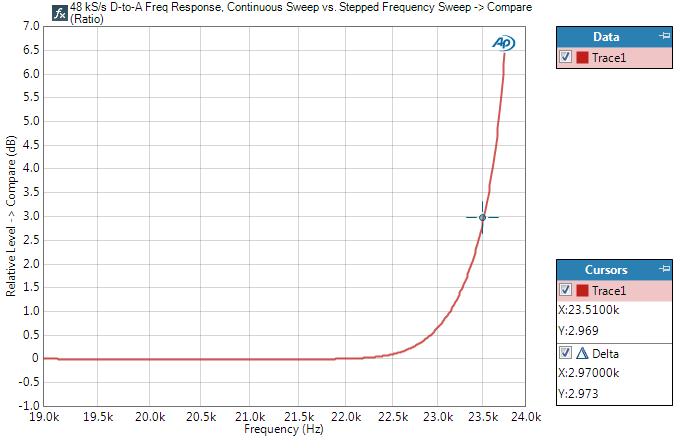
Figure 2 shows the difference between the two response curves, computed by a Derived Result Compare (Ratio) function.
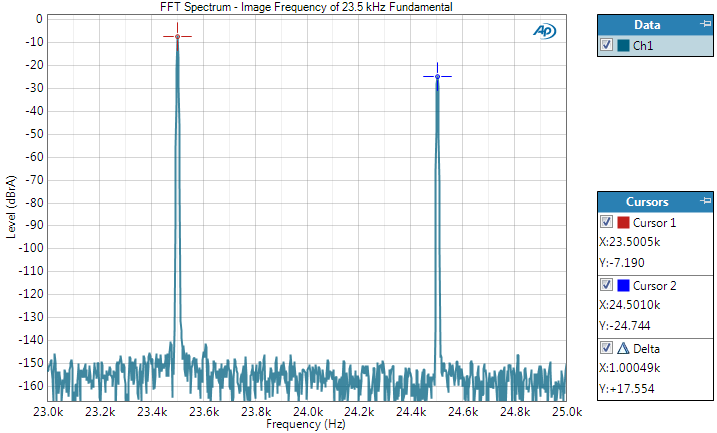
Figure 3 shows the spectrum of the converter output with a 23.5 kHz sinewave signal, 500 Hz below the 24 kHz folding frequency. This reveals the presence of a 24.5 kHz alias signal, 500 Hz above the 24 kHz folding frequency, also known as an image frequency (a folded signal). The Continuous Sweep method did not measure this alias, but the Stepped Frequency Sweep did, resulting in a higher frequency response value at the 23.5 kHz stimulus frequency.
Knowledge of the difference between the two measurement methods can lead to more effective use of each. Use the Continuous Sweep method to reject measurements of alias products. Use Stepped Frequency Sweep for a more comprehensive frequency response test.