
Measuring Equivalent Continuous Sound Level with APx Audio Analyzers
In this post, we answer a question we receive from time to time in Technical Support: How can I measure the equivalent continuous sound level Leq,T and the A-weighted equivalent continuous sound level LAeq,T with my APx500 audio analyzer?
Equivalent Continuous Sound Level
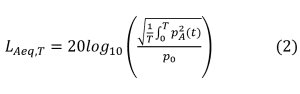
In most environments, ambient sound levels fluctuate continuously with time. The equivalent continuous sound level (Leq) is defined as the constant sound pressure level which, over a given period of time, has the same total energy as the fluctuating sound level. The A-weighted version of the equivalent continuous sound level, denoted LAeq, is the same metric, but with an A-weighting filter applied to the measured signal. LAeq is typically used to quantify the level of noise in the environment, or the noise exposure of employees in a workplace. An integration time is always implied, and it should be specified. For example, if the overall measurement time period (or integration time) is T hours or seconds, then it is denoted LAeq,T, and is defined as shown in (1),
where T is the measurement duration, pA(t) is the instantaneous A-weighted sound pressure in Pa, and p0 is the reference sound pressure (20 µPa).
For audio test engineers who may not be accustomed to working with sound levels, the term “equivalent continuous sound level” with designation LAeq,T, may sound somewhat bizarre. But by rearranging equation (1) as shown in (2), we can put it in more familiar terms.
In this form, you might recognize that the term in the numerator is simply the rms sound pressure level in Pa, averaged over time T, denoted by prms (3). And one of the things that an audio analyzer excels at is measuring rms levels.
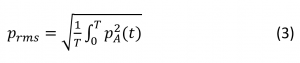
Substituting (3) into (2) yields the classic equation for converting the rms sound pressure level in Pa to sound pressure level in dBSPL.
So, the equivalent continuous sound level for time period T is simply the rms level of the acoustic signal expressed in dBSPL. And to get the A-weighted version, we just need to apply an A-weighting filter to the signal before computing the rms level.
Measuring LAeq,T in APx
In APx500 software, the first step required to measure Leq with analog measurement microphones is to set the Input mode to Acoustic. This changes the measurement units to Pa or dBSPL, and enables each input channel to be assigned a microphone sensitivity in V/Pa. Next, using the Microphone Calibration dialog (Figure 1), you should enter the sensitivity of each microphone to be measured, either from its data sheet, or using a sound level calibrator. Alternatively, if the microphone is programmed with a Transducer Electronic Data Sheet (TEDS) and the equipment is TEDS capable, APx can read the microphone sensitivity directly.
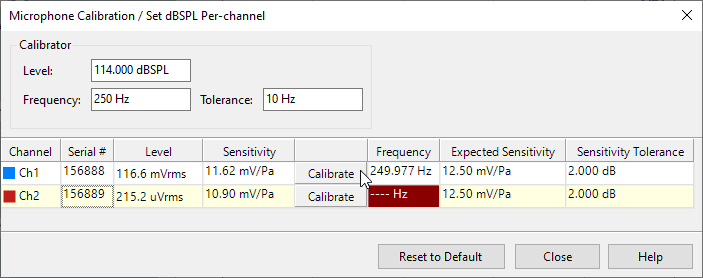
Figure 1. The Microphone Calibration dialog in APx. Clicking a Calibrate button captures the measured microphone sensitivity for the selected channel.
To measure A-weighted sound pressure levels, an A-weighting filter must be applied. In Bench Mode, weighting filters are applied in the Input Section of Signal Path Setup (Figure 2), and they are implemented as digital filters in the time domain. When using an A-weighting filter, the Bandwidth can be set to the lowest setting of 22.4 kHz, and the high-pass and low-pass filter should be set to DC and ADC passband, respectively, so they do not add to the A-weighting filter’s attenuation.
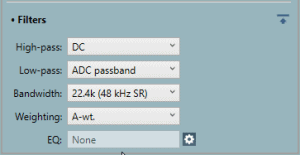
Figure 2. The input Filters section of Signal Path Setup configured for A-weighting.
In Sequence Mode, weighting filters can also be applied in Signal Path Setup, in which case they are also implemented in the time domain. But Sequence Mode offers an additional option for weighting filters, because many measurements in Sequence Mode, such as Noise (RMS) and Noise Recorder (RMS) also have a Weighting Filter control. Weighting filters in individual measurements in Sequence Mode are implemented in the frequency domain via FFT analysis. The choice of whether to apply an A-weighting filter in Signal Path Setup or in individual measurements depends on user preference. However, it is very important to not apply weighting filters both in Signal Path Setup and in a measurement in the same Signal Path. This will yield incorrect results due to the A-weighting being applied twice to the signal!
When the A-weighting filter has been applied in Signal Path Setup, the input Filters for individual measurements in the same Signal Path should be set to “Signal Path”, as shown in Figure 3.
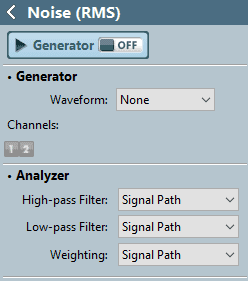
Figure 3. Filter settings for the Noise (RMS) measurement when Signal Path Setup filters have been set as in Figure 2.
Most measurements in APx are designed for measuring rms levels due to a stimulus like a sine wave. As such, they have very short integration times, because typically, we want to complete measurements as quickly as possible. One exception is the Noise (RMS) measurement in Sequence Mode. It has a default integration time of 0.25 seconds, but it can be set to a value as high as 10.0 seconds. The integration time in this measurement is called Acquisition Time, because the measurement computes the level from a single FFT of the entire acquisition. The Acquisition Time control is accessed via the Advanced Settings panel of the measurement. This measurement is a type with a continuously updating meter display, so to measure a fluctuating signal, you should run it from the sequencer and observe the result in the report.
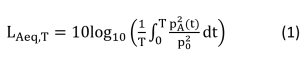
For an example of a fluctuating signal, consider the speech waveform in Figure 4, at a level typical of what might be measured at the Mouth Reference Point of a mouth simulator. It has significant periods of silence, with instantaneous peaks of about 3 Pa (corresponding to a peak level of 103 dBSPL). What is the LAeq of this waveform measured over its total length of 8 seconds? Running the Noise (RMS) measurement from the Sequencer, with the Acquisition Time set to 8.0 seconds and A-weighting applied, the Noise Level result (i.e., the LAeq,8s) returned a value of 82.9 dBSPL. This means the energy equivalent of this signal is a continuous or steady sound at a level of 82.9 dBA.
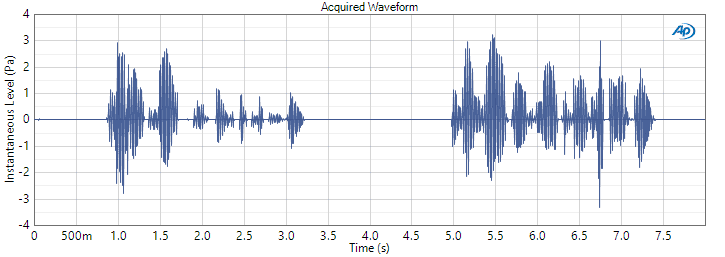
Figure 4. A speech waveform at a level of what might be measured on a mouth simulator at the Mouth Reference Point.
Leq From APx Recorder Measurements
A better way to measure Leq in APx is to take advantage of measurements like Noise Recorder (RMS) in Sequence Mode and Recorder in Bench Mode. These measurements record the short-term rms level of input signals versus time and display them like a strip chart recorder. And they can be configured for a measurement duration of up to 7 days. Sequence Mode Recorder measurements have reading rates from 20 per second to 0.1 per second, and Bench Mode Recorder has reading rates from 250 per second to 1.0 per second. The Bench Mode rms level meter used in its Recorder measurement also has ballistics designed to emulate an analog rms level meter.
When these measurements complete, the RMS Level result will display RMS Level vs time with points separated at (1/reading rate) in seconds, for the entire measurement time. Each point represents the short-term rms level (i.e., short term Leq). Figure 5 shows the RMS Level results for the speech waveform in Figure 4 as measured with Noise Recorder at a reading rate of 20 per second and Bench Mode Recorder at a reading rate of 250 per second.
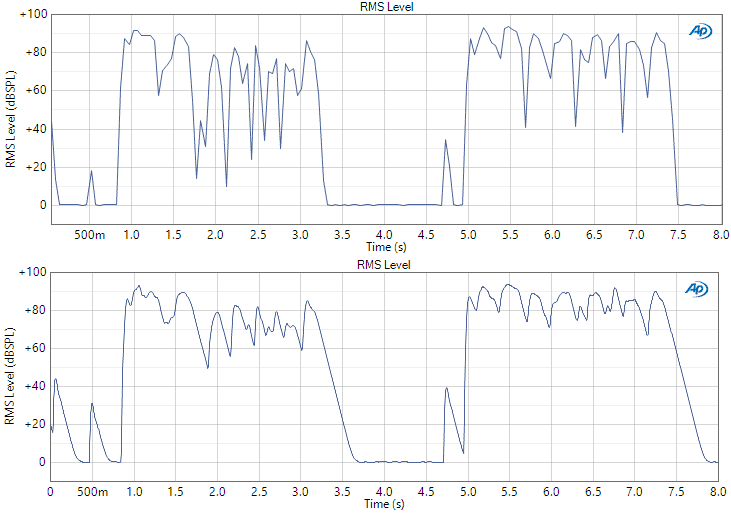
Figure 5. RMS Level vs Time results - Top: Noise Recorder at 20 readings/s; Bottom: Bench Mode Recorder at 250 readings/s.
To get the overall rms level (overall Leq) from the RMS Level vs Time result, you can use a derived result named RMS. To create it, right-click on the RMS Level result and select Add Derived Result - Min/Max Statistics - Single Value - RMS. This computes the overall rms level from the short term rms levels in the RMS Level versus time result. For the speech waveform above, the RMS derived result for Noise Recorder (RMS) and Bench Mode recorder both resulted in rms level (or LAeq,8s) values of 82.9 dBSPL.
It should be noted that if A-weighting is not being used, and the signal contains significant low-frequency energy, the Bench Mode Recorder should be used for better accuracy. This is because rms levels in Sequence Mode are calculated using FFT analysis, and at higher reading rates, the FFT length is too short to accurately estimate the level of low-frequency signals. For example, when measuring a pink noise signal with no-weighting filter, the overall rms level measured with Noise Recorder (RMS) was lower than the value measured using Noise (RMS) by up to 1.6 dB. However, when the signal was A-weighted, or a white noise signal was analyzed, the difference between these two measurements was 0.03 dB or less. For comparison, the worst-case difference between Bench Mode Recorder and Noise (RMS) with pink noise and no weighting filter was 0.14 dB.
This technique of calculating longer duration Leq values from short-term Leq values is widely used in environmental acoustics.
Introducing a new way to access all the latest APx500 software versions
Read more
Understand how audio analyzers’ measurements are not absolute truths but are more so estimates.
Read more
Using APx500 Software and an APx515B Audio Analyzer, Eric Schultheis demonstrates a series of audio measurements, providing insight into device performance.
Read more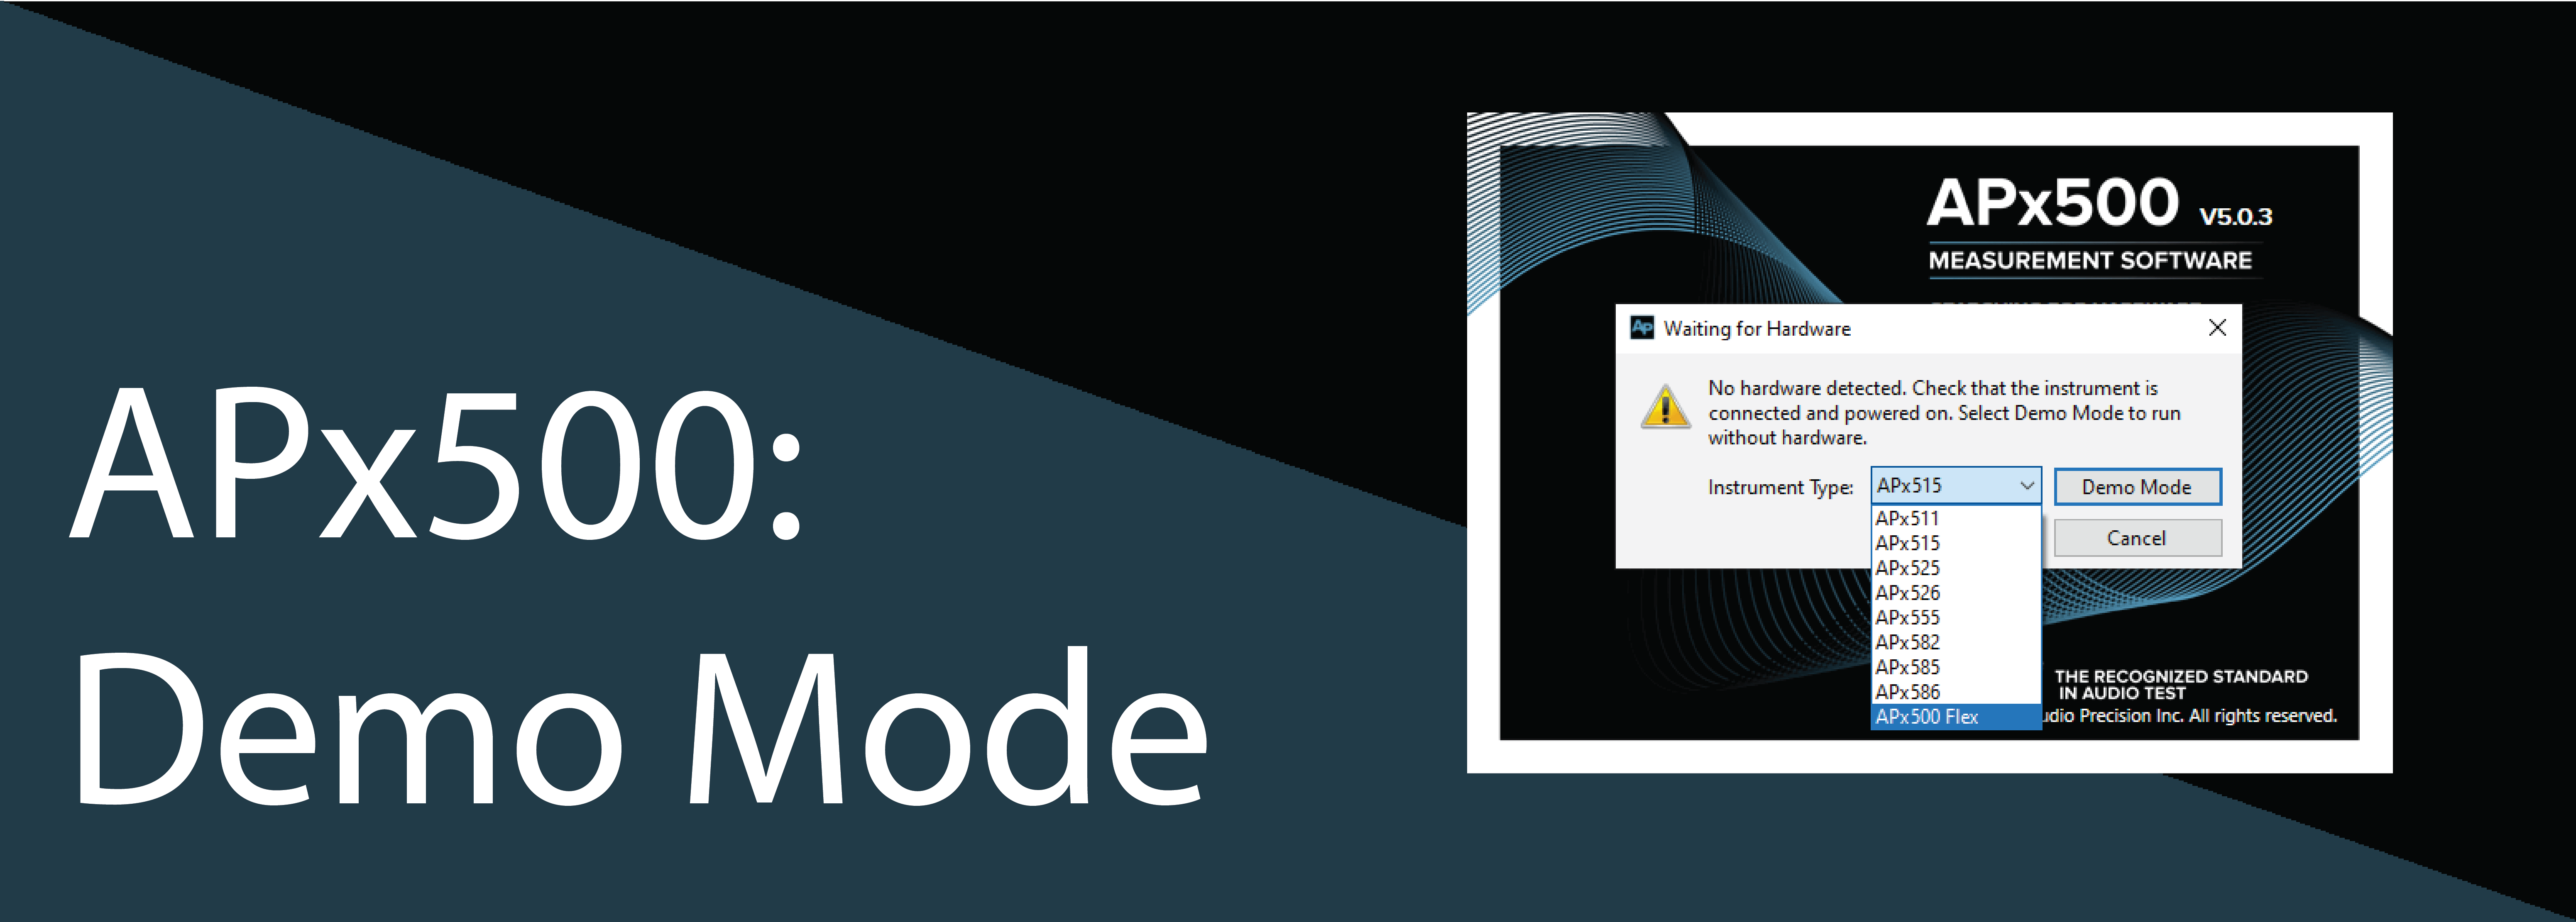
Learn about this free feature in APx500 Software: Demo Mode.
Read more